1.1 Our annual efficiency and finance assessments provide our view of how Network Rail has financially performed each year. This 2024 publication covers CP6 as a whole (April 2019 to March 2024) and the fifth year of the control period, April 2023 to March 2024. It provides detailed support for our Network Rail Annual Assessment published in July, which also covers Network Rail’s operational performance, including in respect of safety risk, train performance and asset management. We also published a detailed annual health and safety report in July.
1.2 Most of the financial information in this report is based on Network Rail’s draft regulatory financial statements. Efficiencies, headwinds and financial risk numbers in this report are presented on a cash basis. All other financial information is presented in 2023-24 prices, except where stated.
1.3 Chapter 2 reports on Network Rail’s overall financial performance, including on its income and expenditure, and on related matters such as changes to efficiency, financial risk management and budgetary flexibility.
1.4 Chapter 3 reports on the financial performance and efficiency of the Scotland region.
1.5 Chapter 4 provides comparisons of the relative financial performance and efficiency of Network Rail’s five regions. These are Eastern, North West and Central (NW&C), Scotland, Southern and Wales and Western (W&W). The chapter also refers to the financial performance of the national functions.
1.6 Annex A provides detailed financial tables for Network Rail’s activities in Great Britain, for England and Wales, and separately for the regions and national functions, and for Wales.
1.7 Annex B explains the relationship between the efficiency and financial performance measures used in our assessments.
How we calculate Network Rail’s financial performance and efficiency
1.8 Different measures can be used to report on a company’s financial performance and there is no uniquely correct measure. Different measures are typically used to complement one another and provide a more rounded assessment. We consulted on these matters in the development of our CP6 regulatory accounting guidelines. These guidelines explain how Network Rail is required to publicly report on its finances in CP6. Our assessments in CP6 focus primarily on two measures:
- Financial performance: This compares income and expenditure to the financial assumptions underpinning CP6 funding. The efficiency improvements that regions are expected to achieve are embedded in the financial assumptions in their CP6 delivery plans. As such, these baselines are described as being ‘post-efficient’. If a region has spent less and / or has received more income than its delivery plan (for what it has delivered), it will report financial outperformance, and vice versa for underperformance.
- Efficiency: This compares the relationship between expenditure on core business activities (operations, support functions, maintenance, and renewals) and outputs on a like-for-like basis over time.
1.9 Our assessments help to give assurance to rail users and funders about whether Network Rail’s regions are delivering what is expected of them whilst providing a reputational incentive for regions to become more efficient.
Financial performance
1.10 Network Rail’s financial performance can be calculated in several ways. The factors to be considered when deciding how to calculate financial performance include:
- to what baselines (or budget) we should compare
- adjustments for the amount of work undertaken
- including or excluding some types of income and expenditure that is less controllable
1.11 Our primary measure of Network Rail’s financial performance is the Financial Performance Measure (FPM). To be as informative as possible, FPM takes each of the above matters into account. FPM compares Network Rail’s income and expenditure to its CP6 delivery plan. It adjusts for the amount of work done and excludes income and expenditure that is not controllable by Network Rail. This includes network grants, fixed track access charges, traction electricity income and costs, and business rates. Our CP6 regulatory accounting guidelines explain how FPM is calculated.
Efficiency
1.12 The priorities for our assessments of efficiency, and hence for Network Rail’s reporting, are to:
- Drive the best outcomes for the users of the rail network through supporting better value for money.
- Enhance regional performance comparisons to aid in benchmarking.
- Move away from measures that aim to be technically precise to a more rounded assessment. This assessment aims to draw out key messages about the drivers of performance, make a clearer link between expenditure and delivery, and examine how efficiencies are being achieved.
- Make better informed forward-looking assessments of the efficiencies that regions are likely to deliver throughout the control period.
- Provide clear and informative messages about efficiency improvements, recognising that different audiences want different levels of technical detail.
1.13 To deliver these priorities, we required Network Rail’s reporting in CP6 to provide:
- Greater emphasis on reporting how regions have delivered efficiency improvements.
- More detailed assessment of the drivers of cost changes over time and across regions.
- A forward-looking view of the efficiencies that Network Rail will likely achieve across CP6. This includes reporting on the progress of regions’ efficiency plans and leading indicators of delivery.
1.14 Efficiency and financial performance are related but not the same. The relationship between these measures is explained in more detail in Annex B.
Regional financial analysis
1.15 Network Rail started CP6 with eight regional operating routes supported by national functions. During the control period, it has reorganised these routes into five geographical regions (Eastern, North West and Central (NW&C), Scotland, Southern and Wales and Western (W&W)). It has also devolved some national functions to regions. Network Rail still has routes, although there are now 14 of them. The routes are now a sub-geography of the five regions. A map of Network Rail’s five regions is shown in Figure 1.1.
1.16 Network Rail developed a CP6 delivery plan which set out how it intended to deliver the requirements of our PR18 determination within the funding available. It subsequently revised its delivery plan from being route-based to region-based. So, for the purpose of comparing Network Rail’s financial performance to our PR18 funding assumptions, we use Network Rail’s revised CP6 delivery plan as the funding baseline in this assessment.
Figure 1.1: The geography of Network Rail’s regions
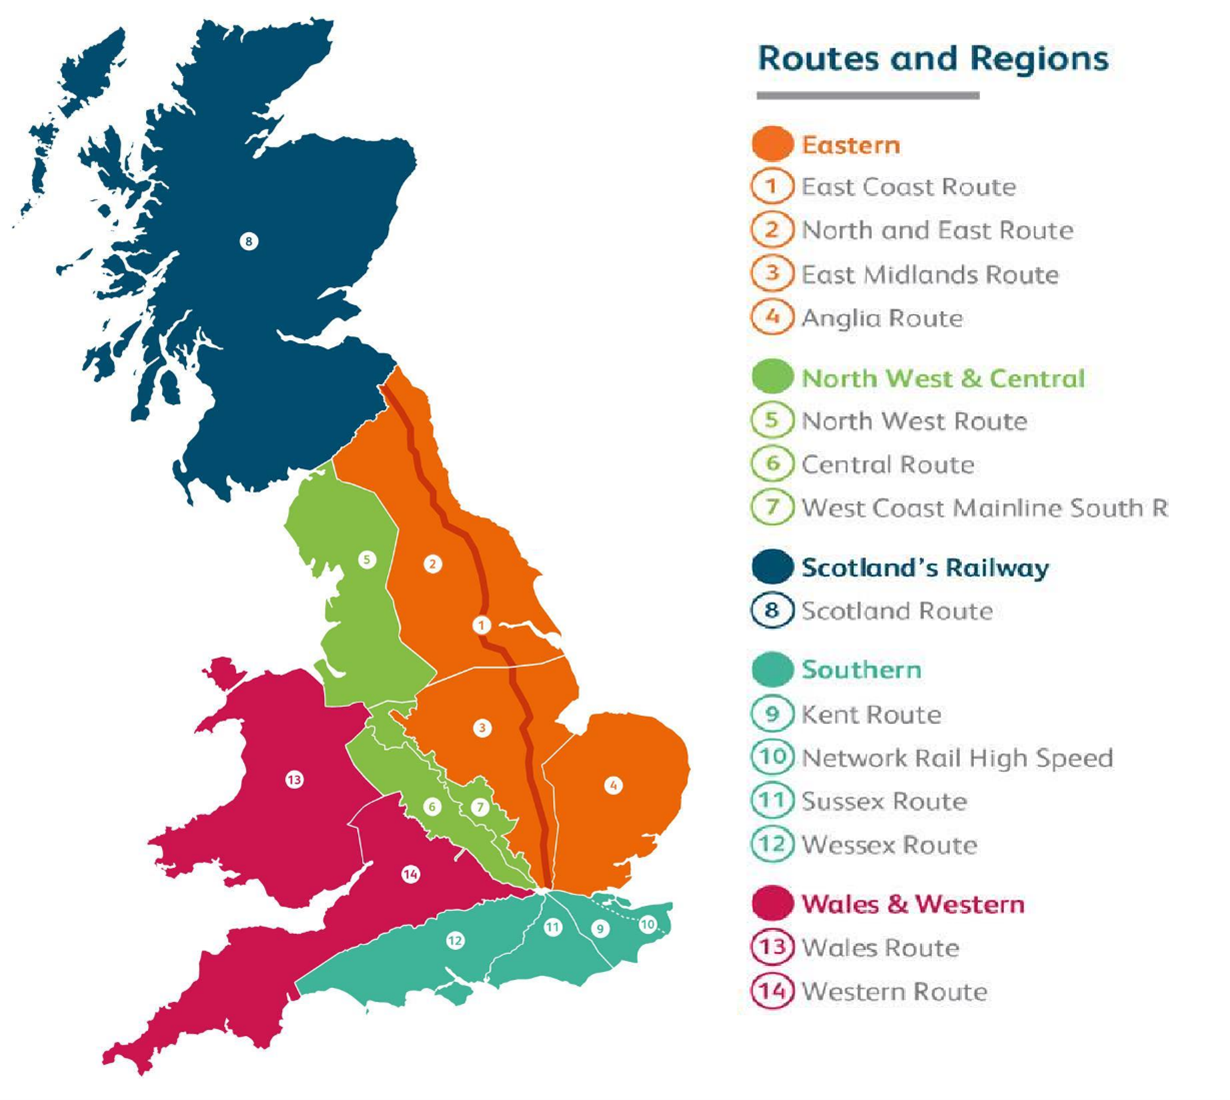
Source: Network Rail
1.17 We welcome comments on the content of this report. These should be sent to:
Customer Correspondence Team
Office of Rail and Road
25 Cabot Square
London E14 4QZ
Email: contact.cct@orr.gov.uk