Our efficiency and finance assessment of Network Rail for 2024 relates to the fifth year of control period 6 (CP6). It also looks back at CP6 as a whole, which ran from 1 April 2019 to 31 March 2024.
Executive summary
Network Rail’s funding and requirements for Control Period six (CP6) were set out in our 2018 periodic review (PR18). This determined what Network Rail should deliver and improve in respect of operating, maintaining, and renewing its network, and the funding that we considered necessary to do this for the five year period from 1 April 2019 to 31 March 2024.
This document sets out our assessment of Network Rail's efficiency and wider financial performance in the year to 31 March 2024, the final year of CP6, and our assessment for CP6 overall. This document provides a more detailed assessment of Network Rail’s financial performance to support our recent Network Rail Annual Assessment. It covers Network Rail’s activities across Great Britain as a whole and separately for each of Network Rail’s regions in England & Wales, and Scotland.
Our assessment primarily focuses on two measures, financial performance and efficiency. The financial performance measure (FPM) compares Network Rail’s income and expenditure to the company’s CP6 delivery plan. It assesses whether, in aggregate, Network Rail has delivered its required activities for more or less than it was funded to deliver them.
Our efficiency measure examines the drivers of cost changes over time and across regions of Network Rail’s core business activities (operations, support functions, maintenance, and renewals). As such, financial performance and efficiency are related measures, though there are important differences which are explained in this report.
Our assessments and reporting of Network Rail’s efficiency and financial performance are important because they provide assurance to rail users and funders that Network Rail’s regions are delivering what is expected and, at the same time, provides a reputational incentive for them to become more efficient.
Network Rail delivered £1.1 billion of efficiency improvements in the final year of CP6 and £4.0 billion of efficiency improvements in CP6 as a whole. However, the company financially underperformed by £0.9 billion in the year and by £2.8 billion in CP6. This means that Network Rail spent £2.8 billion more than expected for what it delivered. This outcome of financial under-performance at the same time as efficiency out-performance is because of structural differences between the two measures which are explained in this document.
Network Rail spent £67.4 billion (2023-24 prices) operating, maintaining, renewing, enhancing and financing the national rail infrastructure in CP6, when adjusted for inflation.
This represents a 3% decrease compared to CP5. Additionally, Network Rail incurred £7.0 billion of financing costs on its historic debt (mostly due to accretion on index linked debt), these costs are separately funded by government. Figure 1 gives the breakdown by main areas of activity. We explain this further in chapter 2.
Annex A provides a more detailed breakdown of Network Rail’s income and expenditure for April 2023 to March 2024 and CP6.
Figure 1: Network Rail’s expenditure in CP6 (2023-24 prices)
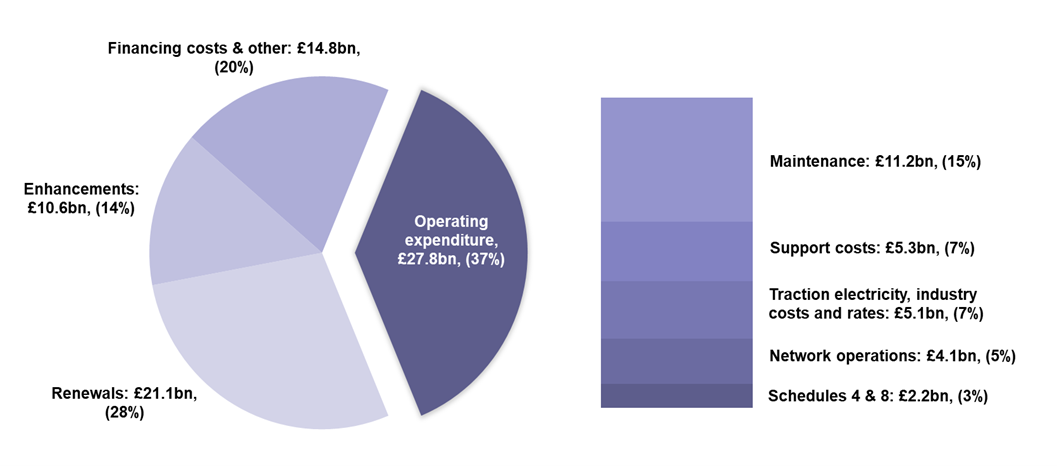
Source: ORR analysis of Network Rail data
Key findings
The key findings from our assessment are:
1. Network Rail successfully delivered £4.0 billion of efficiency improvements in CP6, exceeding our five-year target
Network Rail delivered £4.0 billion of efficiency improvements in CP6, ahead of our PR18 target of £3.5 billion. Following the COVID-19 pandemic, Network Rail increased its own target to £4.0 billion. Despite the significant business challenges of COVID-19, industrial action and a volatile macroeconomic environment, Network Rail achieved this target from a range of initiatives including staff related savings, workforce modernisation, utilisation of in-house skills to improve works delivery, possession management and improvements driven by changes in standards.
Figure 2: Efficiency improvements in CP6, April 2019 to March 2024
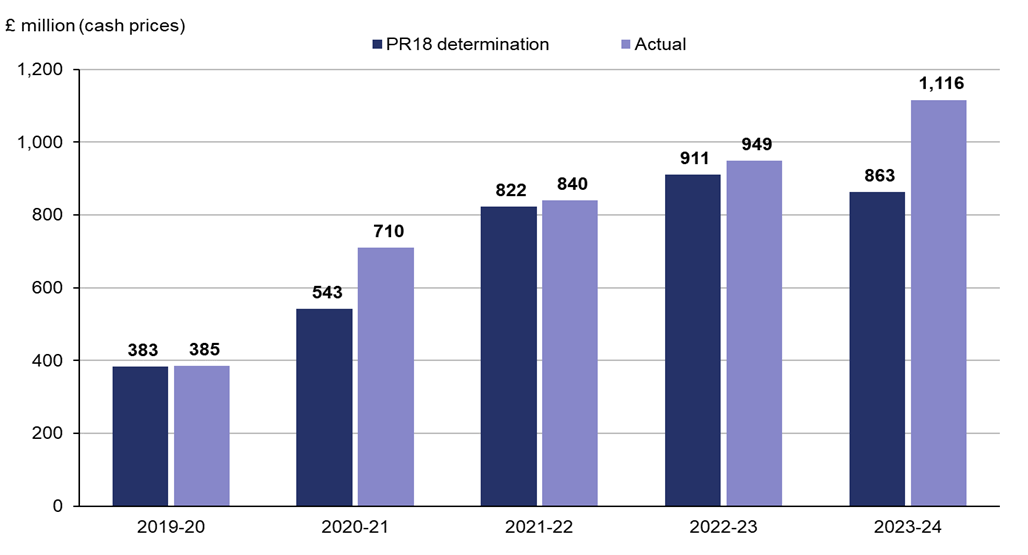
Source: ORR analysis of Network Rail’s data
In April 2023 to March 2024, the final year of the control period, Network Rail delivered £1.1 billion of efficiency improvements. This represents an annual increase of 18%.
Figure 3: Regional contributions to efficiency improvements in CP6
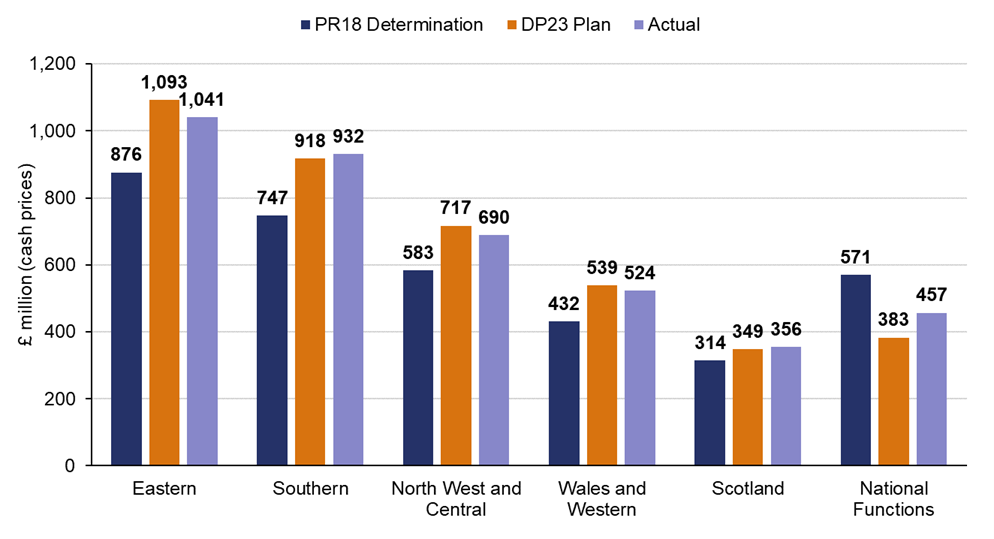
Source: ORR analysis of Network Rail’s data
As shown in Figure 3, all five of Network Rail’s regions exceeded our CP6 targets set in the periodic review of 2018 (PR18). Southern and Scotland also exceeded their 2023 delivery plan (DP23) targets by 2%, while other regions fell slightly short. Eastern and North West and Central were slightly behind their delivery plan target as a result of setting additional stretch targets in an effort to deliver further efficiencies than planned.
With the conclusion of CP6, our monitoring has moved on to CP7 (control period 7), for which our PR23 final determination requires Network Rail to make £3.7 billion (2023-24 prices) of efficiency improvements over the next five years (equivalent to £3.9 billion in cash prices). To ensure that Network Rail regions’ and central functions’ CP7 efficiency plans are robust, we recently commissioned an independent reporter (Nichols Group) to review these efficiency plans (see key finding 8 below and chapter 2 for more details).
2. Wider financial performance suffered due to a number of factors including the COVID-19 pandemic and industrial action
Network Rail financially underperformed by £0.9 billion in the year April 2023 to March 2024 and cumulatively by £2.8 billion over CP6. This means that net of income, the company spent £2.8 billion more for what it delivered than it was funded to deliver, despite exceeding our efficiency target. Factors that affected this underperformance included unplanned costs and disruption from the COVID-19 pandemic, industrial action and extreme weather events, under delivery of planned renewals and inflationary pressures.
Whilst Network Rail has made good progress at improving its efficiency in CP6, it has underperformed on the financial performance measure (FPM). This difference in outcomes is because of structural differences between the two measures. FPM encompasses most of Network Rail’s income and expenditure, whereas efficiency only includes operations, support, maintenance and renewals (OSMR) expenditure; FPM compares to a post efficient delivery plan baseline, whereas efficiency compares back to the final year of the preceding control period. For example, large cost pressures, such as the COVID-19 pandemic, inflation and industrial action (mostly affecting Schedule 4 & 8 payments), have adversely affected FPM reporting but are beyond the scope of efficiency reporting. These matters are further examined in our report.
3. Network Rail managed significant financial shocks and fully used its CP6 risk fund
Following ORR’s PR18 final determination, Network Rail allocated £3.0 billion (cash prices) to manage unforeseen financial risks. The flexibility provided by this fund to manage financial risks helped enable Network Rail to manage significant financial pressures during CP6 resulting from the COVID-19 pandemic, industrial action, severe weather events and changes in inflation.
Experience in CP6 has shown the importance of allocating a proportion of funding to efficiently manage unforeseen financial risks across a five-year control period. Our 2023 periodic review (PR23) final determination set out that Network Rail should set aside £1.7 billion (2023-24 prices) of risk funding (£1.5 billion for England and Wales and £0.2 billion for Scotland) for CP7.
4. Network Rail’s headcount increased by 1% across CP6, although average employment costs fell by 4%
Network Rail employed 41,252 staff in the last year of CP6, a 1% increase from the end of CP5 (on a full time equivalent (FTE) basis). Overall, headcount increased significantly in the first three years of the control period, which the company attributed to resourcing needs to implement its ‘Putting Passengers First’ programme, with headcount reducing over the final two years.
Senior management grades increased by 5% to around 650 FTEs during the year and have increased by 21% from the end of CP5.
Maintenance headcount decreased by 4% to 14,834 FTEs during the year and has decreased by 11% compared to the end of CP5. A large portion of this reduction followed the implementation of Network Rail’s modernising maintenance programme which aims to improve staff rostering and deployment of the workforce. The company expects this programme to deliver further improvements to maintenance activities across CP7.
Network Rail’s use of agency staff decreased by 22% in the year to 850 people. This represents a 12% decrease from the end of CP5.
The average employment cost for a permanent employee in April 2023 to March 2024 was £62,782, of which 26% related to overtime, allowances, performance related pay and employer pension contributions. As shown in Figure 4, the average employment cost in the year was 4% (£2,817) lower than the end of CP5, while permanent staff headcount levels increased by 1% (463 people).
Figure 4: Average salary and headcount of permanent staff
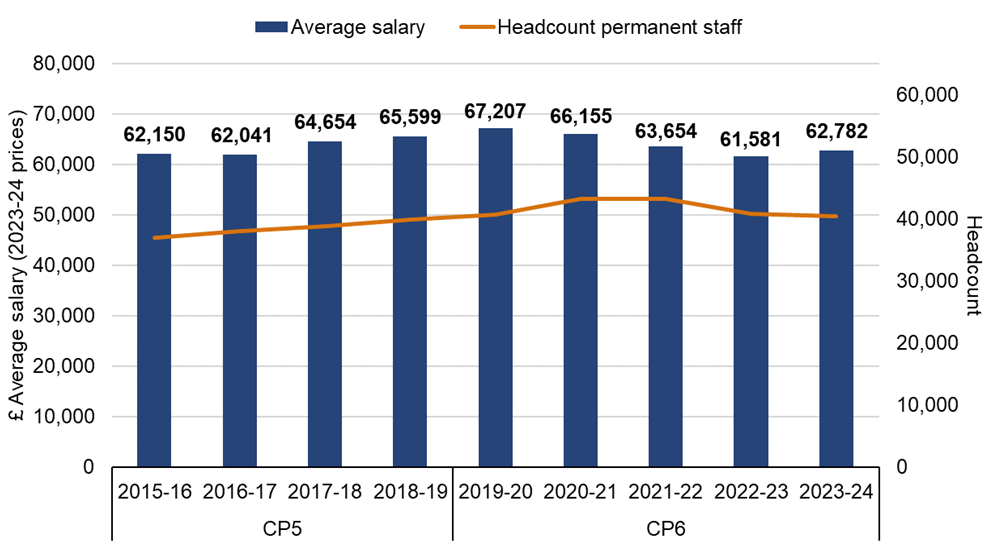
Source: ORR analysis of Network Rail’s data
5. Network Rail Scotland delivered its efficiency improvements over CP6, exceeding our five year target and its revised delivery plan
Network Rail Scotland successfully delivered £356 million of efficiency improvements over CP6. This was 13% beyond our 2018 periodic review (PR18) determination target (£314 million) and 2% beyond Network Rail Scotland’s revised delivery plan (£349 million).
Following the COVID-19 pandemic, Network Rail Scotland increased its CP6 efficiency target from the £314 million that we set it in our PR18 final determination to £412 million. However, during Year 4 (April 2022 to March 2023), the region revised down its target to £349 million due to changes to its planned renewals volumes in Year 4 and Year 5 and delays to the implementation of workforce reform initiatives. Network Rail Scotland successfully achieved this revised plan.
With the conclusion of CP6, our monitoring has moved on to CP7, for which our PR23 final determination requires Network Rail Scotland to make £389 million (cash prices excluding centrally delivered efficiencies), or £410 million (2023-24 prices including allocation of centrally-delivered efficiencies) of efficiency improvements over the next five years.
To ensure that Network Rail Scotland’s CP7 efficiency plans are robust, we recently commissioned an independent reporter (Nichols Group) to review these efficiency plans (see key finding 8 and chapter 3 for more details).
6. Network Rail spent £10.6 billion on railway enhancements in CP6, 48% less than in CP5
Network Rail spent £10.6 billion on government funded enhancements to the rail network over CP6 when adjusted for inflation, 48% less than in CP5. The CP6 average yearly spend in Great Britain was £2.1 billion compared to £4.1 billion in CP5 and £2.7 billion in CP4 (2023-24 prices).
Major enhancement projects undertaken in the year included Transpennine Route Upgrade (£699 million), East Coast Digital (£284 million), Midland Main Line Programme (£192 million) and East West Rail Phase 2 (£119 million).
Network Rail Scotland spent £972 million on government funded enhancements in CP6 when adjusted for inflation, 56% less compared to CP5. The average yearly spend in CP6 was £194 million compared to £442 million in CP5 and £240 million in CP4 (2023-24 prices).
Key enhancement expenditure in the year included Levenmouth Rail Link (£57 million), Busby Junction to Barrhead Electrification (£25 million) and Feeder Stations programme (£22 million).
Figure 5: Enhancements expenditure, April 2009 to March 2024
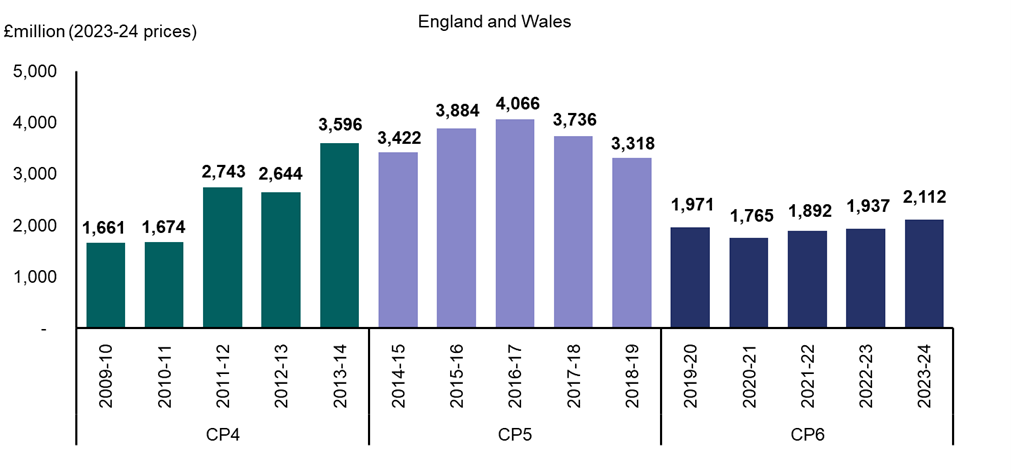
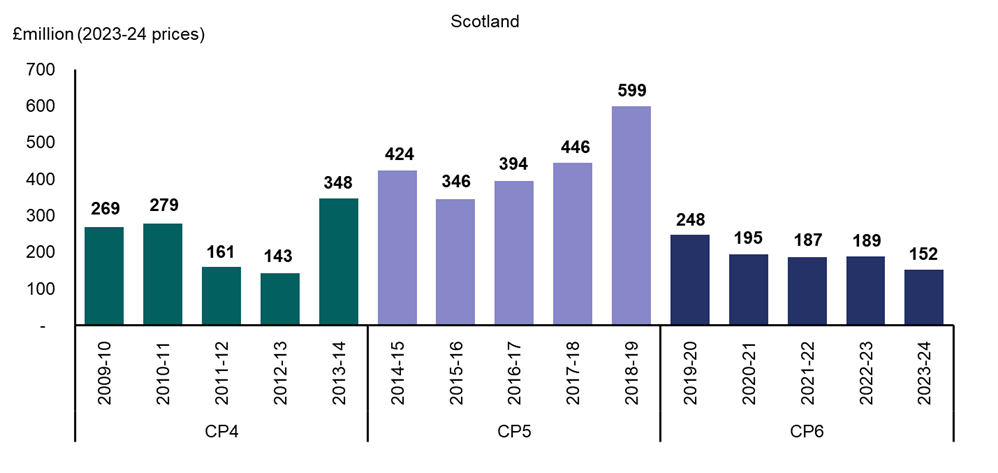
Source: ORR analysis of Network Rail’s data
7. Forward look to CP7
With the conclusion of CP6, our monitoring has moved on to CP7 (1 April 2024 to 31 March 2029). Over the next five years Network Rail plans to spend £43.1 billion (2023-24 prices) to operate, maintain, and renew Great Britain’s railway network, as set out in its CP7 delivery plan.
Our PR23 final determination requires Network Rail to make £3.7 billion (2023-24 prices) of efficiency improvements over the next five years (£3.2 billion in England and Wales, and £0.4 billion in Scotland). Through its CP7 delivery plan, Network Rail has set out how it intends to achieve these required efficiency improvements. In cash terms the projected efficiencies over the next five years are £3.9 billion for the GB network (very similar to those achieved in CP6).
To ensure that Network Rail’s CP7 efficiency plans are robust, we recently commissioned an independent reporter (Nichols Group) to review these plans with a focus on Year 1 and Year 2 plans. The review has found that:
- Network Rail’s efficiency plans for CP7 are reasonable and aligned to our PR23 final determination, with almost 80% of the initiatives sampled at a relatively mature stage of planning. There is good evidence of robust assurance of efficiency plans within each of Network Rail’s regional divisions.
- There is consistent categorisation of efficiency initiatives across regions and evidence of cross-regional engagement.
- Documentation about the business changes underpinning efficiencies (based on a sample of initiatives) is variable, with both good examples as well as those with insufficient supporting information. The approach to establishing baselines and the level of detail presented varied across regions.
- The delivery plan makes use of overplanning on efficiency initiative to manage delivery risk, which is good practice. However, Nichols highlights that this approach to overplanning and the use of overlays (to take the forecast back to target), may be obscuring the view of real forecasts. Evidence suggests that there is an opportunity for regions to apply greater effort on delivering efficiency improvements earlier in CP7.
While Nichols’ review has found that Network Rail’s CP7 efficiency plans are broadly robust at this stage, we have wider concerns about Network Rail's CP7 delivery plan in relation to the funding risk to delivery of its core asset requirements. In particular, our assessment in March this year identified a funding gap of £0.4 billion for England and Wales regions. We wrote to Network Rail requiring this matter to be resolved in the first six months of CP7. It is important for Network Rail to provide assurance that the renewal and maintenance of its core assets will be delivered as expected in CP7 and we are concerned that Network Rail has not yet made sufficient progress on this matter.
We recognise the fiscally challenging context in which Network Rail is operating in CP7 and that financial risks will continue to evolve as CP7 progresses. Nevertheless, we will continue to pursue this matter with Network Rail to ensure that renewals and maintenance of core assets are delivered as expected.
This matter does not affect Network Rail Scotland which does not have a funding gap in its delivery of core business requirements.