4.1 This chapter provides an analysis of the efficiencies and wider financial performance of each of Network Rail’s five regions: Eastern, North West and Central (NW&C), Scotland (Chapter 3 provides a separate more detailed analysis for Scotland region. The region is also included in the analysis in this chapter to improve comparisons across regions.), Southern, and Wales and Western (W&W). The financial information reported for each region includes its allocation of the national functions’ income and costs. Caution is needed when comparing the relative performance of regions due to the differences in their geographical and operational characteristics.
Financial performance
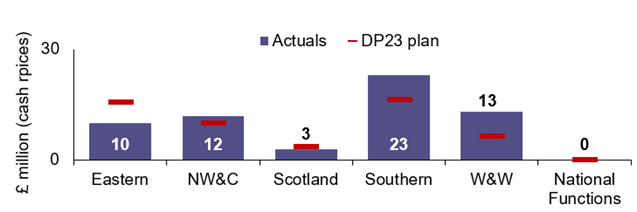
4.2 As shown in Figure 4.1, all regions underperformed compared to their delivery plan for the year. Annex A provides detailed financial tables for each region.
Figure 4.1: Regional contributions to Network Rail’s financial underperformance
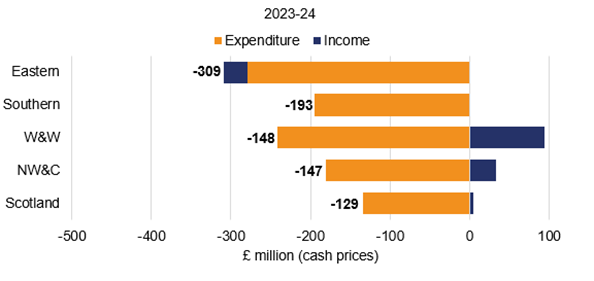
Source: ORR analysis of Network Rail’s data
Eastern
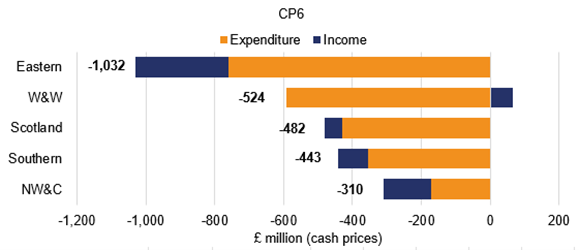
4.3 Eastern underperformed by £309 million in April 2023 to March 2024 compared to its delivery plan and by £1,032 million over CP6.
4.4 In April 2023 to March 2024, Eastern has attributed this underperformance to:
- Maintenance Costs (£172 million underperformance). This was due to extra work being completed on vegetation management and inflationary pressures on materials prices.
- Support Costs (£38 million underperformance). This was caused by higher electricity prices driving utilities costs and extra capabilities built-up through the ‘Putting Passengers First’ (PPF) re-organisation programme.
- Renewals (£35 million underperformance). This was due to higher like for like capital project costs, income and maintenance expenditure being heavily affected by industrial action related delays and reprioritisations.
- Franchised track access charges (£33 million underperformance). The underperformance is due to a combination of reduced services being run as a result of industrial action and lower traction electricity charges as market prices have not risen as quickly as the delivery plan assumed.
- Schedule 8 (£29 million underperformance). Schedule 8 performance this year has suffered due to several factors. These included asset failures across the infrastructure and disruptive weather.
- Schedule 4 (£20 million underperformance). This was due to higher possession activity which has been less productive than planned, higher number of disruptive events such as weather and storms and rise in inflation which has increased Schedule 4 compensation rates.
North West and Central
4.5 The region underperformed by £147 million in April 2023 to March 2024 compared to its delivery plan and by £310 million cumulatively over the five years of the control period.
4.6 In April 2023 to March 2024, North West and Central has attributed this underperformance to:
- Support costs (£56 million underperformance). This was due to rising electricity prices, as pre-purchase protections were no longer in effect.
- Schedule 8 (£55 million underperformance). Schedule 8 performance this year has suffered due to several factors including asset failures across the infrastructure and disruptive weather.
- Maintenance costs (£26 million underperformance). Track was the highest area of maintenance spend caused by greater than anticipated inflation increases in materials and contractor costs.
- Network operations (£23 million underperformance). This was due to the additional recruitment to improve workforce capabilities as part of a Network Rail company-wide strategy. Increased costs are also due to deploying extra staff at stations to offer a better service to the travelling public and incurring higher costs for running stations as inflation has risen faster than expected.
4.7 North West and Central suggests underperformance was partially offset by outperformance relating to:
- Other income (£27 million outperformance). Additional other income due to better than planned property sales.
Southern
4.8 Southern underperformed by £193 million in April 2023 to March 2024 compared to its delivery plan and by £443 million cumulatively over the five years of the control period.
4.9 In April 2023 to March 2024, Southern has attributed this underperformance to:
- Maintenance costs (£135 million underperformance). This underperformance was due to additional works undertaken on the network to improve performance and safety, the re-organisation surrounding PPF, increased inspections and extra costs to comply with track worker safety standards.
- Renewals (£51 million underperformance). This was due to increased investment being required to combat adverse performance related to earthworks and signalling renewals.
- Schedule 4 (£29 million underperformance). This was mainly due to the impact of industrial action in April 2022 to March 2023.
- Other income (£13 million underperformance). This underperformance was largely due to lower income from property rental as an ongoing effect from the COVID-19 pandemic.
4.10 Southern suggests underperformance was partially offset by outperformance relating to:
- Schedule 8 (£14 million outperformance). This outperformance is the highest of all the regions in the year. Despite industrial action and periods of extreme heat, which have affected most other regions, Southern remained resilient which has led to increased net compensation received from train operators within the year.
- Franchised track access charges (£14 million outperformance). This is due to lower traction electricity income being offset by contractual inflation benefits on charges made to operators.
Wales and Western
4.11 The region underperformed by £148 million in April 2023 to March 2024 compared to its delivery plan and by £524 million cumulatively over CP6.
4.12 In April 2023 to March 2024, Wales and Western has attributed this underperformance to:
- Schedule 8 (£100 million underperformance). This was due to the region not meeting its train performance targets as a result of industrial action, disruptive weather and a higher number of asset failures across the infrastructure, all contributing to poor performance.
Separately, we carried out an investigation into train performance in the region and published a report. Wales and Western has developed plans to improve performance which include more frequent inspections, replacing overhead electrical lines and using better data to understand where faults are. The benefits may require some time to be realised. - Maintenance costs (£52 million underperformance). This was due to extra work being undertaken to improve assets, addressing regional backlogs relating to signalling and telecoms and higher volumes of de-vegetation and track worker safety compliance.
- Schedule 4 (£42 million underperformance). This was due to the industrial action that took place throughout the control period leading to more compensation payments being made to train operators.
- Network operations costs (£35 million underperformance). This was due to higher costs to comply with changing fatigue management standards, costs associated with the new Elizabeth Line and increased staff to offer better signalling and operational resilience.
- Support costs (£27 million underperformance). Mainly due to higher electricity prices driving utilities costs.
4.13 Underperformance at Wales and Western was partially offset by outperformance relating to:
- Other income (£90 million outperformance). This is due to proceeds from additional property sales.
- Renewals (£26 million outperformance). This was due to an increase in performance within its capital works delivery for the year.
Scotland
4.14 Detailed information on Network Rail Scotland’s financial performance can be found in chapter 3.
Efficiencies
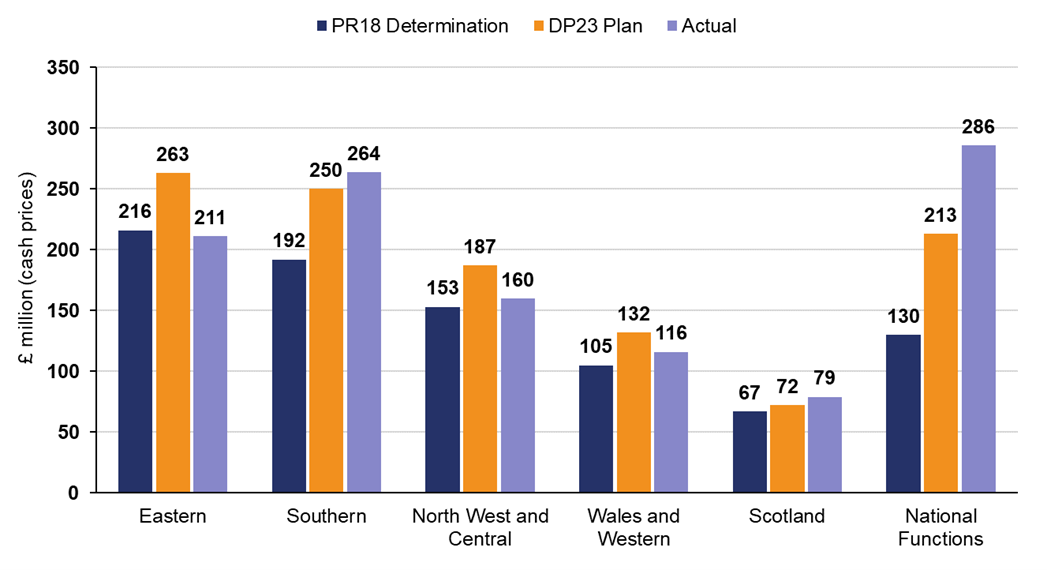
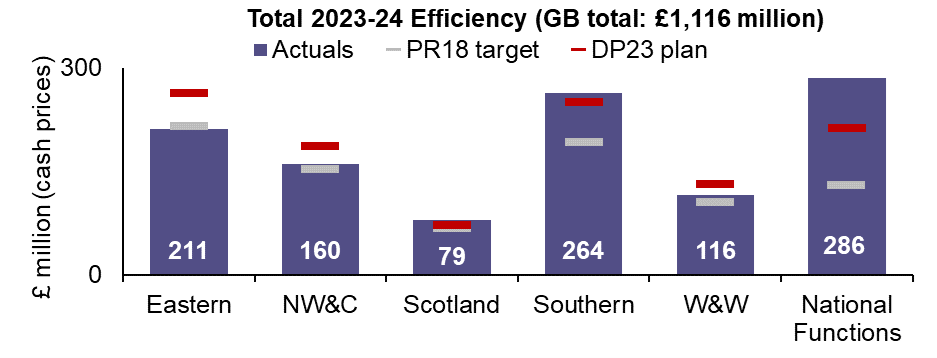
4.15 Figures 4.2 and 4.3 show that Southern, Scotland and National functions exceeded their delivery plan (DP23) efficiency targets in April 2023 to March 2024. All the other regions missed their DP23 plans for the financial year, with Eastern missing its plan by the largest amount (£52 million).
Figure 4.2: Regional contributions to efficiency improvements, April 2023 to March 2024
Source: ORR analysis of Network Rail’s data
Figure 4.3: Regional contributions in April 2023 to March 2024 and CP6 efficiencies
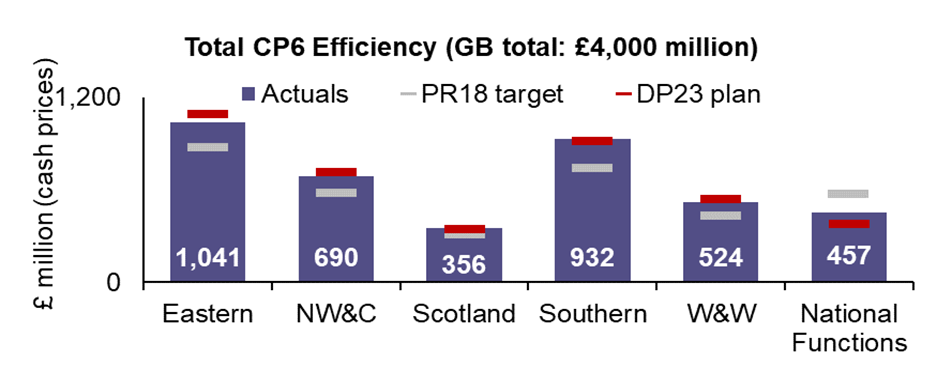
Source: ORR analysis of Network Rail’s data
4.16 Figure 4.4, normalises the information in Figure 4.3 for relevant expenditure, reflecting the different sizes and operational characteristics of each region.
Figure 4.4: Regional efficiencies in April 2023 to March 2024 and CP6, normalised by OMR expenditure
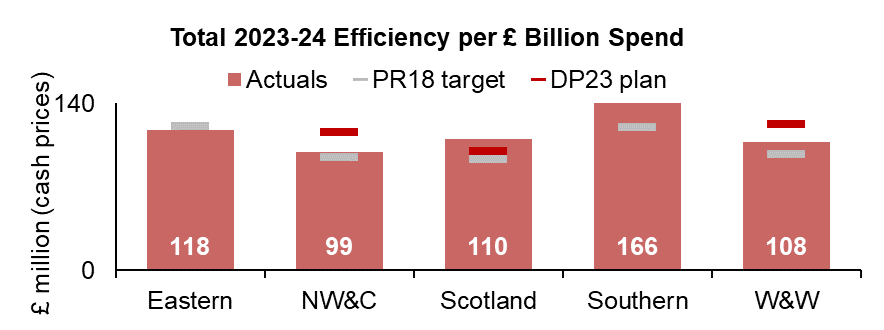
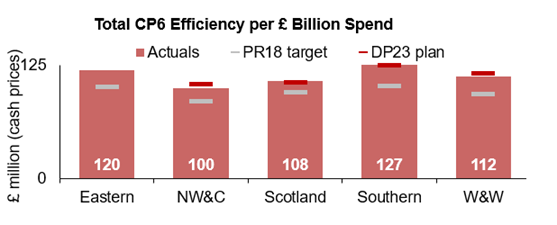
Source: ORR analysis of Network Rail’s data
4.17 Regional contributions to Network Rail’s CP6 efficiency trajectory are shown in Figure 4.5.
Figure 4.5: Regional contributions to actual efficiency in each year of CP6
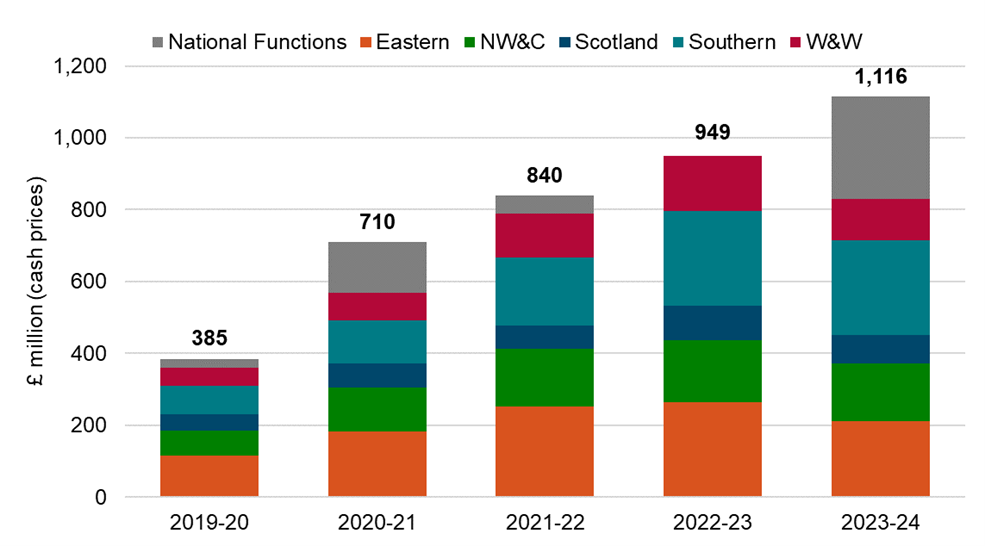
Source: ORR analysis of Network Rail’s data
Eastern
4.18 Eastern reported £211 million of efficiency improvements in April 2023 to March 2024, missing its DP23 plan for the year of £263 million by 20%, mainly due to cash constraints resulting in cancelled and deferred works across the region. Eastern delivered £1,041 million of efficiency improvements in CP6, missing its DP23 target for CP6 by 5%. The largest three efficiency initiatives for the region in the year were development of work delivery capabilities (£73 million), improved contracting strategies, packaging and rates (£46 million) and workforce modernisation (£43 million).
North West and Central
4.19 North West and Central reported £160 million of efficiency improvements in April 2023 to March 2024, missing its DP23 plan of £187 million for the year by 14%. This was due to the LEAN programme delivering less efficiencies than planned. The region aimed to deliver £717 million of efficiency improvements in CP6 but missed its DP23 plan by 4%. The largest efficiency initiative for the region in the year was delivering the same output for lower activity/volume (£31 million) and in CP6 was the development of works delivery capabilities (£73 million).
Scotland
4.20 Between April 2023 and March 2024, Network Rail Scotland reported £79 million of efficiency improvements, exceeding its 2023 delivery plan of £72 million for the year by 10%. The largest three initiatives within the year included improved contracting strategies, packaging and rates (£16 million), modernisation (£15 million) and workbank planning (£6 million).
4.21 Please refer to chapter 3 for more detail on Network Rail Scotland’s efficiency delivery.
Southern
4.22 Southern reported £264 million of efficiency improvements in April 2023 to March 2024, exceeding its DP23 plan for the year of £250 million by 6%. Southern delivered £932 million efficiency improvements in CP6, surpassing its DP23 plan of £918 million. When efficiency spend is normalised by each of the region’s operations, maintenance and renewals (OMR) spend, Southern achieved more efficiencies than all other regions both in year and across the control period, achieving:
- 41% in year and 6% in CP6, more efficiencies than the next highest performing region
- 68% in year and 27% in CP6, more than the lowest performing region, when normalised by OMR
4.23 The largest three efficiency initiatives for the region in the year were improved contracting strategies, packaging, and rates (£43 million), workforce modernisation (£28 million) and early contractor involvement (£23 million).
Wales and Western
4.24 Wales and Western reported £116 million of efficiency improvements in April 2023 to March 2024, missing its plan of £132 million for the year by 12%. This is partly due to the lack of staff modernisation efficiencies being realised in the year. The region’s aim was to deliver £539 million of efficiency improvements in CP6 but it delivered £524 million, largely due to a decrease in reform efficiencies across the final years of CP6. The largest three efficiency initiatives for the region in the year were innovation and technology benefits (£26 million), improved contracting strategies, packaging, and rates (£22 million) and workforce modernisation (£20 million).
The five largest efficiency initiatives in April 2023 to March 2024
4.25 The next section shows regional contributions to the five largest efficiency initiatives overall in April 2023 to March 2024. It also compares actual efficiency achievements to regional delivery plans for the year (DP23 plans). Network Rail has cautioned that it does not use the delivery plan as a target and that there are various changes during the year that will impact the deliverability of initiatives. Some efficiencies have also been re-categorised and re-prioritised. These factors may contribute to the variances reported between actual efficiencies and planned efficiencies at an initiative level.
1 Modernisation
Figure 4.6: Efficiencies due to Modernisation (GB total: £273 million)
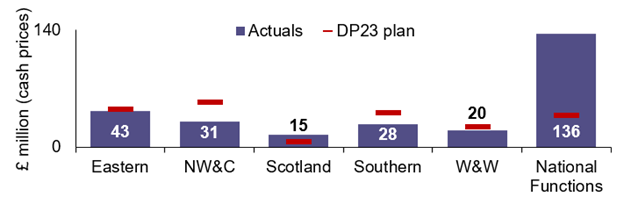
Source: ORR analysis of Network Rail’s data
4.26 Network Rail achieved £273 million of efficiencies relating to Modernisation in the year. These efficiencies have been driven by modernisation initiatives such as the voluntary severance scheme and management reform. Eastern did particularly well, achieving £43 million of efficiencies in this category, however the most success with this initiative has been seen within the national functions and is due to lower than expected costs from implementing workforce reforms. Despite this being the largest efficiency initiative, all regions except Scotland missed their DP23 delivery plan targets for this initiative.
2 Improved contracting strategies, packaging, and rates
Figure 4.7: Efficiencies due to improved contracting strategies, packaging and rates (GB total: £187 million)
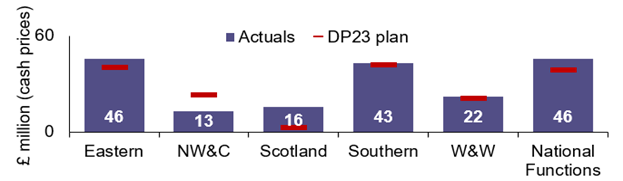
Source: ORR analysis of Network Rail’s data
4.27 Network Rail achieved £187 million of efficiencies relating to improved contracting strategies, packaging, and rates in the year. This is 11% above its DP23 plan of £169 million. This was driven by national functions and all regions except North West and Central exceeding their DP23 plan targets.
3 Development of works delivery capabilities
Figure 4.8: Efficiencies due to development of works delivery capabilities (GB total: £76 million)
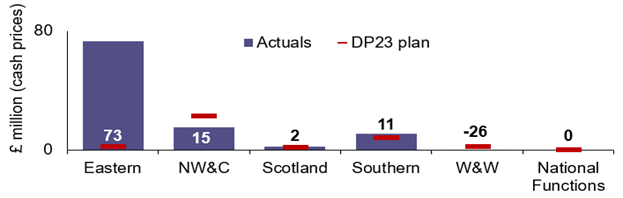
Source: ORR analysis of Network Rail’s data
4.28 Network Rail achieved £76 million of efficiencies relating to development of works capabilities in the year. This initiative surpassed its DP23 plan of £37 million.
4 Innovation and technology benefits
Figure 4.9: Efficiencies due to innovation and technology benefits (GB total: £63 million)
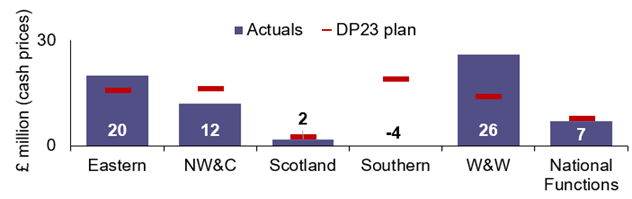
Source: ORR analysis of Network Rail’s data
4.29 Network Rail achieved £63 million of efficiencies relating to innovation and technology benefits in the year. This was the fourth largest efficiency initiative overall for the year. Wales and Western did particularly well, achieving £26 million of efficiencies in this category whereas Southern reported £4 million of inefficiencies. Network Rail suggests this was due to prior year corrections actioned in 2023 to 2024 by Southern, in relation to Telecoms following assurance activities around the plan to upgrade to a more modern, networked CCTV system that would utilise more cost effective widely available cameras.
5 Early contractor involvement, defined scope, minimum specification solution
Figure 4.10: Efficiencies due to early contractor involvement, defined scope, minimum specification solution (GB total: £61 million)
Source: ORR analysis of Network Rail’s data
4.30 Network Rail achieved £61 million of efficiencies relating to early contractor involvement in the year. This is 15% higher than its delivery plan target of £53 million. Although Eastern and Scotland did not meet their DP23 targets, the other regions have all still achieved high levels of efficiency in this area, making it the fifth largest efficiency initiative for Network Rail.
Underperforming efficiency initiatives
4.31 We highlight efficiency initiatives which underperformed against their delivery plans.
(a) Reduced activity due to other new technologies
Inefficiencies of £29 million arose from reduced activity due to other new technologies in the year. Network Rail’s DP23 plan for this initiative was that it would generate £68 million of efficiencies. North West and Central outperformed its delivery plan and Wales and Western met its delivery plan. Southern missed its DP23 plan and Eastern generated the highest level of inefficiencies. The inefficiency reported is due to prior year corrections in Eastern (£66 million) and Southern (£14 million).
(b) Pay and Benefits
There were £89 million of inefficiencies in Pay and Benefit initiatives in the year, whereas Network Rail expected to generate £3 million of efficiencies, with all regions generating inefficiencies. Network Rail indicates that this was driven by a change in workforce reform plans in the year which increased modernisation benefits, but as a result reduced pay and benefit efficiencies.
(c) Optimisation of access (use, agreement, planning)
There were £2 million of inefficiencies in the year from optimisation of access initiatives. By contrast in the DP23 plan, £44 million of optimisation of access initiative efficiencies were forecast. Eastern, Southern, North West and Central and Wales and Western performed worse than their DP23 plan. This was due to prior year corrections across the regions.