Financial performance
2.1 Our primary measure of Network Rail’s financial performance is the financial performance measure (FPM). FPM provides a better understanding of Network Rail’s financial performance than simple income and expenditure variances to a baseline / budget as it takes into account what has actually been delivered. A positive FPM means that Network Rail has outperformed, and a negative FPM means that Network Rail has underperformed. FPM and efficiency are complementary measures that provide a rounded assessment of Network Rail’s performance and changes over time (see Annex B for details).
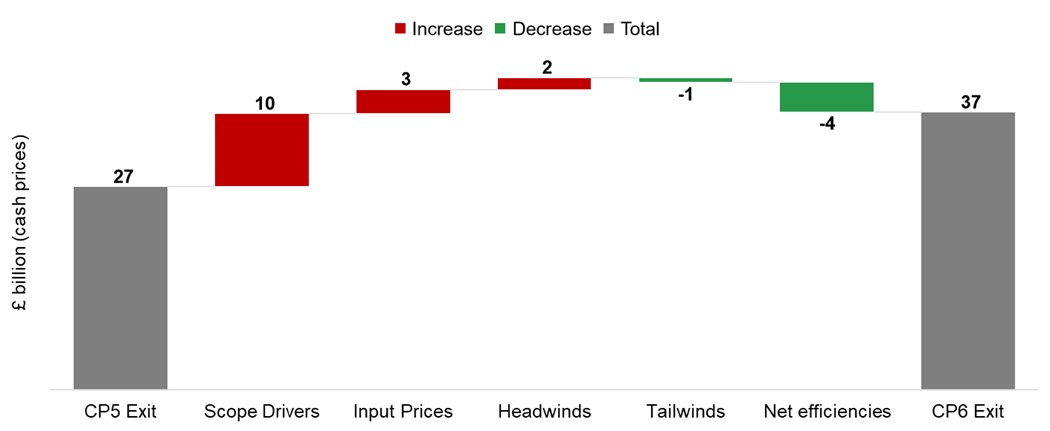
2.2 Network Rail spent £14,817 million (cash prices) operating, maintaining, renewing and enhancing the national rail infrastructure in April 2023 to March 2024, financially underperforming by £924 million against its CP6 delivery plan for the year. Network Rail spent £66,503 million (cash prices) in CP6, underperforming by £2,789 million against its CP6 delivery plan. This underperformance was partly funded from use of the company’s CP6 risk fund. Figure 2.1 illustrates the factors contributing to Network Rail’s financial underperformance in CP6.
Figure 2.1: Contributions to Network Rail’s financial underperformance in CP6
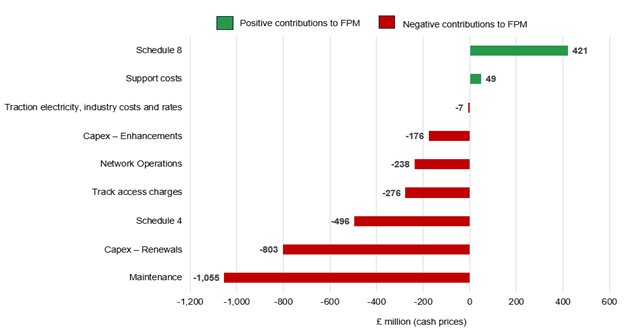
Source: ORR analysis of Network Rail’s data
Table 2.1: Network Rail’s financial performance, Great Britain, April 2023 to March 2024 and CP6
| £ million(cash prices) | 2023-24 | 2023-24 | 2023-24 | CP6 | CP6 | CP6 |
|---|---|---|---|---|---|---|
| Actual | FPM out / (under) performance | % of FPM contribution | Actual | FPM out / (under) performance | % of FPM contribution | |
| Network grant income | 8,329 | 0 | 0% | 34,206 | 0 | 0% |
| Franchised track access charges | 3,157 | (7) | (1%) | 13,569 | (276) | (10%) |
| Other income | 882 | 112 | 12% | 3,857 | (209) | (7%) |
| Total income | 12,369 | 105 | 11% | 51,633 | (485) | (17%) |
| Schedule 4 | 411 | (79) | (9%) | 2,111 | (496) | (18%) |
| Schedule 8 | 258 | (189) | (20%) | (89) | 421 | 15% |
| Network operations | 810 | (110) | (12%) | 3,617 | (238) | (9%) |
| Support costs | 1,169 | (155) | (17%) | 4,777 | 49 | 2% |
| Traction electricity, industry costs and rates | 1,101 | (4) | (0%) | 4,583 | (7) | (0%) |
| Maintenance | 2,282 | (435) | (47%) | 9,944 | (1,055) | (38%) |
| Total operating expenditure | 6,031 | (971) | (105%) | 24,943 | (1,325) | (48%) |
| Renewals | 3,940 | (68) | (7%) | 18,752 | (803) | (29%) |
| Enhancements | 2,264 | 10 | 1% | 9,505 | (176) | (6%) |
| Total capital expenditure | 6,203 | (58) | (6%) | 28,256 | (979) | (35%) |
| Risk expenditure | 0 | 0 | 0% | 0 | 0 | 0% |
| Financing costs and other | 2,583 | 0 | 0% | 13,304 | 0 | 0% |
| Total expenditure | 14,817 | (1,029) | (111%) | 66,503 | (2,304) | (83%) |
| Financial performance measure (FPM) | (924) | (100%) | (2,789) | (100%) |
Source: ORR analysis of Network Rail’s data. Numbers may not sum due to rounding
2.3 Table 2.1 summarises Network Rail’s financial performance against its budgeted income and expenditure which were set out in its CP6 delivery plan.
2.4 Network Rail’s financial underperformance in CP6 was caused by several factors including costs incurred from the COVID-19 pandemic, inflationary pressures, industrial action and costs of completing legacy CP5 enhancements. Figure 2.1 shows Schedule 8 over CP6 was highly positive due to better than expected performance over the pandemic period as a result of fewer passengers and services being run. This was largely offset by increased Schedule 4 payments due in large part to industrial action and inflationary pressures, which added further to costs later in the control period. Maintenance was the largest contributor to underperformance, reflecting additional work delivered and expenses responding to the COVID-19 pandemic, which saw increased premium costs for staff, investment in PPE and investment in vehicle shields and extra vehicles.
2.5 Figure 2.2 shows the contributions of Network Rail’s five regions to the company’s financial underperformance.
Figure 2.2: Regional contributions to Network Rail’s financial underperformance
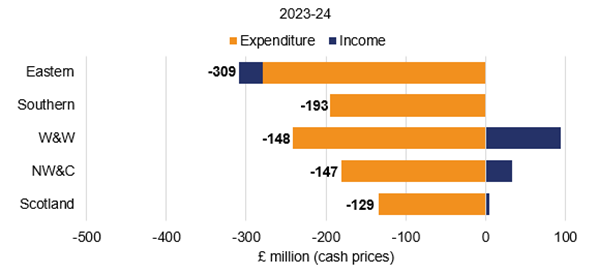
Source: ORR analysis of Network Rail’s data
Expenditure
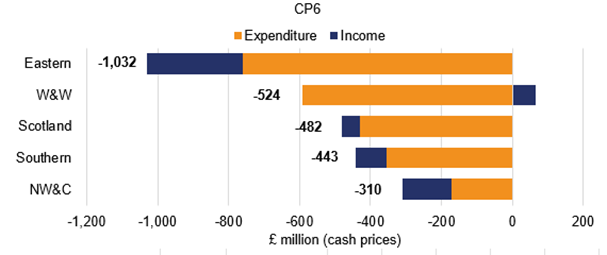
2.6 Network Rail spent £66,503 million (cash prices) operating, maintaining, renewing and enhancing rail infrastructure in CP6. Figure 2.3 shows the main categories of Network Rail’s expenditure, and these are examined below. Numbers included in this section are in cash prices.
Figure 2.3: Network Rail’s expenditure in CP6 (cash prices)
Source: ORR analysis of Network Rail’s data
Operating expenditure
2.7 Operating expenditure relates to maintenance activities, network operations, support costs, traction electricity, industry costs and rates, and the Schedule 4 and 8 regimes. These expenditure items are examined below.
Maintenance
2.8 Maintenance expenditure relates to activities that maintain the condition and capability of the existing infrastructure to the previously assessed standard of performance.
- Network Rail spent £9,944 million in CP6, £1,171 million higher than the DP19 delivery plan (DP19) and underperforming by £1,055 million. Additional costs were incurred maintaining the network during the COVID-19 pandemic due to additional PPE and travel costs.
- Network Rail spent £2,282 million maintaining its network in April 2023 to March 2024, £469 million higher than planned, underperforming by £435 million. Network Rail has mostly attributed this underperformance to staffing disruption, rise in cost due to inflation and additional costs to comply with track worker safety regulations.
Network operations
2.9 Network operations expenditure relates to activities to operate the rail network. This includes signalling and operating Network Rail’s managed stations.
- In CP6, Network Rail spent £3,617 million, which was £238 million higher than the delivery plan, resulting in an £238 million underperformance. This was due to extra costs incurred during the COVID-19 pandemic, inflationary pressures emerging in the second half the control period, additional recruitment to reduce overtime/address an aging skilled workforce and compliance with fatigue management standards.
- Network Rail spent £810 million operating the network in April 2023 to March 2024, £110 million higher than the delivery plan with a £110 million underperformance for the same additional recruitment reasons as explained above.
Support costs
2.10 Support costs relate to activities that facilitate Network Rail’s core business activities. These include corporate functions and IT services.
- Network Rail spent £4,777 million in CP6, £312 million more than the delivery plan. Costs have been higher across the control period with the impact of the ‘Putting Passengers First (PPF) re-organisation programme causing the need for additional resources, inflationary pressures in the latter part of the control period and COVID-19 related expenditure which have been partly offset by additional efficiencies in centrally managed activities. Some renewals costs were also reclassified to support costs in CP6 resulting in a cost variance to the original CP6 delivery plan. This change does not affect FPM. Adjusted for this, support costs outperformed by £49 million due to managing insurance claim risks within the Network Rail group, rather than paying external parties’ insurance premiums.
- Support costs were £1,169 million in April 2023 to March 2024, £230 million higher than the delivery plan with an underperformance of £155 million. This was largely due to increased utilities costs, in particular electricity prices, in the wake of geopolitical disruption and uncertainty.
Traction electricity, industry costs and rates
2.11 Network Rail purchases electricity to provide power for electrically powered trains. These costs are largely matched by an equal amount of income from train operators (Network Rail retains a minimal amount of the cost for the electricity it uses). Industry rates and other costs include Network Rail’s share of British Transport Police costs, business rates, Rail Safety and Standards Board (RSSB) costs, the ORR licence fee, and railway safety levy. Network Rail has limited control over these costs, which are either set by government agencies, or are driven by train operator usage and market prices in the case of traction electricity costs.
- Traction electricity, industry costs and rates were £4,583 million for CP6, underperforming by £7 million.
- In the period April 2023 to March 2024, Network Rail spent £1,101 million, underperforming by £4 million. These items are largely not controllable by Network Rail, so they largely do not contribute to its financial performance measure.
Schedule 4 and Schedule 8 costs
2.12 The Schedule 4 regime compensates train operators for planned reductions to network availability. It incentivises Network Rail to plan engineering work early and efficiently to reduce disruption. The Schedule 8 performance regime compensates train operators or Network Rail for the impact of unplanned service disruption.
- Over CP6 Schedule 4 costs were £2,111 million, £493 million more than planned and underperforming by £496 million. This resulted from the poor train performance in April 2022 to March 2023, during which the company had to compensate train operators for failing to deliver the agreed timetables for passengers due to disruptions caused by industrial action.
- Schedule 4 costs were £411 million in the year to March 2024, which was £100 million higher than delivery plan, with an underperformance of £79 million.
2.13 The Schedule 8 performance regime compensates train operators or Network Rail for the impact of unplanned service disruption.
- Over CP6 Schedule 8 costs were -£89 million, spending £421 million less than delivery plan. This was driven by the exceptional performance during COVID-19 times where fewer passengers and services resulted in increased punctuality and timetable resilience.
- Schedule 8 costs were £258 million for April 2023 to March 2024, £189 million more than delivery plan. This is largely the result of poor train performance brought on by disruptive weather, notably in the Wales and Western region, and higher asset failures across the infrastructure all of which contributed to disruption to train services.
Renewals
2.14 Renewals expenditure relates to activities to replace (in whole, or in part) network assets that have deteriorated such that they can no longer be maintained economically. Renewal of an asset restores the original performance of the asset and can add additional functionality as technology improves.
- Network Rail spent £18,752 million in CP6, £269 million higher than delivery plan with an underperformance of £803 million being recognised. Underperformance over the control period was driven by higher costs associated with the increased focus upon track worker safety, earthworks and drainage assets.
- Network Rail spent £3,940 million renewing the rail network in April 2023 to March 2024, £62 million less than planned but still underperforming by £68 million. This was mostly due to industrial action impacting several renewals projects, resulting in aborted costs and delays to planned activities.
Enhancements
2.15 Enhancements are changes to improve network capacity or capability, for example, enabling more train journeys or higher speeds. Enhancement schemes are subject to approvals on a case by case basis from Department for Transport (DfT) and Transport Scotland (TS) under their ‘pipeline’ approaches for releasing funding as individual projects progress.
- Network Rail spent £9,505 million on government-funded enhancements schemes in CP6, underperforming by £176 million largely due to legacy CP5 programmes that were completed early in CP6. Projects in development stages are excluded from the financial performance measure until they are sufficiently advanced to have a clear view of the agreed baselines for scope, outputs and costs with funders.
- Network Rail also spent £434 million on third-party funded schemes in the year and £2,105 million in CP6.
- Network Rail spent £2,264 million on government-funded enhancements in April 2023 to March 2024. Expenditure on the main schemes is summarised in Table 2.2
Table 2.2: Network Rail’s enhancements expenditure in April 2023 to March 2024
| £ million (cash prices) | 2023-24 | 2023-24 | CP6 | CP6 |
|---|---|---|---|---|
| Actual | FPM out / (under) performance | Actual | FPM out / (under) performance | |
| Trans Pennine Route Upgrade | 699 | 1 | 2,189 | 20 |
| East Coast Digital | 284 | 0 | 591 | 0 |
| Midland Main Line Programme | 192 | 0 | 871 | 0 |
| Access for All | 128 | 0 | 275 | 0 |
| East West Rail Phase 2 | 119 | (1) | 860 | (1) |
| Other DfT funded schemes | 69 | 5 | 267 | 4 |
| Cambridge South Station Development 2 | 71 | 0 | 101 | 0 |
| East Coast Main Line Enhancements Programme | 69 | 23 | 628 | (6) |
| Hope Valley Capacity | 60 | (10) | 135 | (11) |
| Oxford Corridor Capacity Phase 2 | 53 | (10) | 105 | (10) |
| Restoring Your Railway | 51 | 3 | 153 | 2 |
| Levenmouth Rail Link | 57 | 0 | 104 | 0 |
| Other Network Rail-funded enhancements | 414 | 1 | 3,228 | (172) |
| Total Network Rail-funded enhancements | 2,264 | 10 | 9,505 | (176) |
| Third party-funded enhancements (including HS2) | 434 | 0 | 2,105 | 0 |
| Total enhancements | 2,698 | 10 | 11,610 | (176) |
Source: ORR analysis of Network Rail’s data. Numbers may not sum due to rounding.
Employment costs
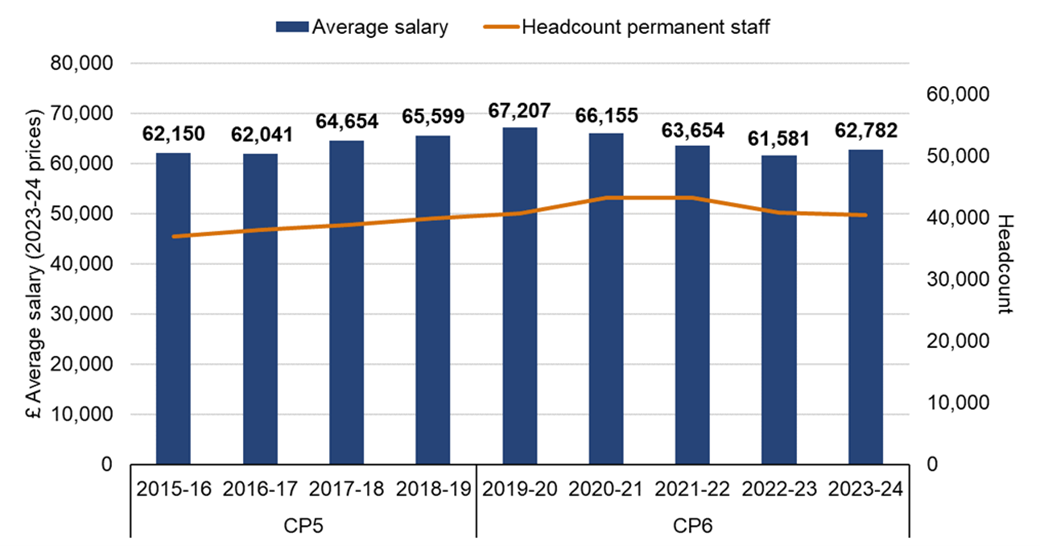
2.16 In April 2023 to March 2024, Network Rail employed an average of 41,252 staff, a 1% increase from the end of CP5 (on a full time equivalent (FTE) basis). In the first three years of the control period headcount increased notably due to resourcing needs from Network Rail’s implementation of its “Putting Passengers First” programme, with headcount reducing over the last two years of CP6.
2.17 The average employment cost for a full-time employee in April 2023 to March 2024 was £62,782, of which 26% was from overtime, allowances, and employer pension contributions. As illustrated in Figure 2.4, the average employment cost for the year decreased by 4% (£2,817, 2023-24 prices) compared to the end of CP5, while the number of permanent staff increased by 1% (463 people).
Figure 2.4: Average salary and headcount of permanent staff
Source: ORR analysis of Network Rail data
2.18 Senior management grades increased by 5% to around 650 FTEs during the year, this represents a 21% increase in these grades compared to the end of CP5.
2.19 Maintenance headcount reduced by 4% to around 14,834 FTEs during the year, and by around 11% compared to the end of CP5. Network Rail is continuing to make further improvements in its maintenance activities through its modernising maintenance programme which will include further improvements to staff rostering. Network Rail expects the programme to deliver further improvements to maintenance activities across CP7.
2.20 Network Rail’s agency FTE staff headcount reduced by 22% in the year to 850 people. This represents a 12% decrease from the end of CP5.
Income
2.21 Network Rail received £51,633 million (cash prices) of income in CP6. Figure 2.5 provides a breakdown of the main sources for this income. For the year April 2023 to March 24 Network Rail received £12,369 million of income, a 9% year on year increase (£1,032 million). Numbers included in this section are in cash prices.
Figure 2.5: Network Rail’s income for CP6: Total income: £51,633 million (cash prices)
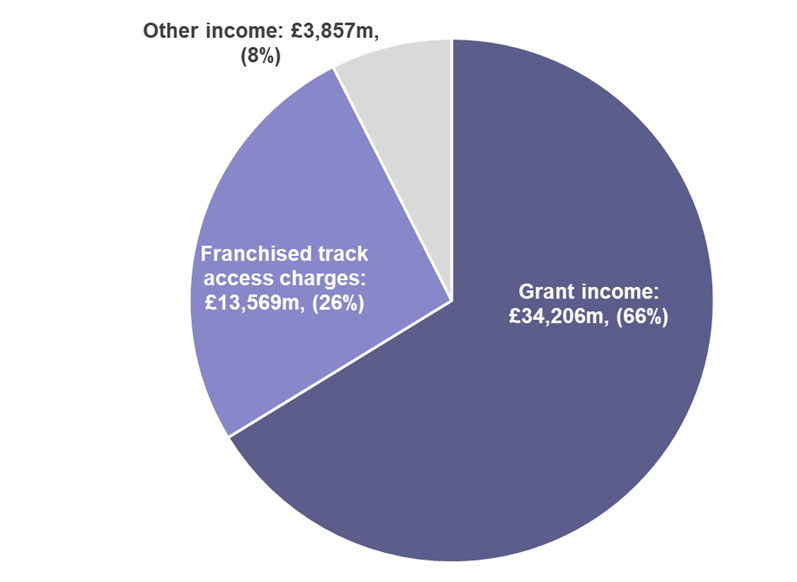
Source: ORR analysis of Network Rail’s data
Grant Income
2.22 Grant income refers to the funding received from the Government or other public bodies to support operations and projects.
- Network Rail received £34,206 million grant income in CP6, £487 million lower than planned. Lower interest and corporation tax costs have meant Network Rail has not required as much in government grants across CP6.
- Network Rail received £8,329 million of grant income in April 2023 to March 2024. This is a 7% annual increase and £625 million more than set out in the delivery plan. Income is higher than the delivery plan for the year which reverses some of the reduced income in earlier years. The extra income this year represented a different phasing of activity being undertaken than anticipated in the delivery plan. Franchised track access charges income
2.23 Franchised track access charges income for Network Rail comes from fees paid by train operating companies to use its rail infrastructure.
- Franchised track access charge income was £13,569 million in CP6. This was £686 million lower than Network Rail’s CP6 delivery plan, mostly due to reduced services impacted by the COVID-19 pandemic, structural changes to industry and lower traction electricity charges.
- Franchised track access charge income was £3,157 million from April 2023 to March 2024. This is a 10% annual increase and £123 million more than set out in the delivery plan, mostly due to higher-than-expected inflation resulting in increased payments by operators under track access charges.
Other income
2.24 Other income includes revenue from freight and stations, property rentals and sales, depot operations, and freight traction electricity.
- In CP6 Network Rail received £3,857 million of other income. Income was £316 million higher than planned as a result of property disposals offsetting reduced property rental income caused by the COVID-19 pandemic.
- Other income in year was £882 million which has increased by 26% (£180 million) compared to last year. Other single till income was £113 million higher than set out in the delivery plan due to increased property sales levels.
Efficiency
2.25 In determining the funding that Network Rail would need to deliver its required outputs in CP6, we assessed the efficient level of expenditure that it required. The detailed assumptions on expenditure and efficiency underlying these projections were set out in our 2018 periodic review (PR18), where we challenged Network Rail to make £3.5 billion of efficiency improvements (in cash prices).
2.26 Network Rail responded to our PR18 determination by developing a CP6 delivery plan which included how it intended to deliver our efficiency challenge. Recognising the increased financial pressures from unanticipated cost increases from the COVID-19 pandemic, Network Rail subsequently increased its internal CP6 efficiency target to £4.0 billion, with the planned increase coming mostly from workforce reform initiatives. Throughout this document we refer to this as Network Rail’s revised CP6 delivery plan.
2.27 In the year April 2023 to March 2024 Network Rail delivered £1,116 million of efficiency improvements, an 18% annual increase in line with its delivery plan target. Network Rail has reported £4.0 billion of efficiency improvements in CP6 ahead of our PR18 target of £3.5 billion.
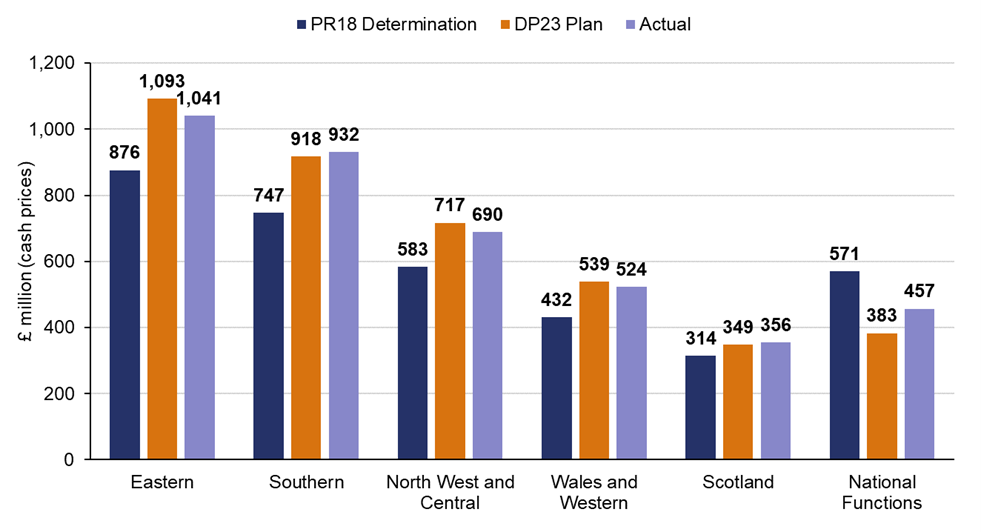
2.28 However, as shown in Figure 2.6, there are important regional variations. All regions exceeded our CP6 targets. Notably, Southern and Scotland exceeded their revised delivery plan targets by 2% whilst the remaining regions fell slightly short.
2.29 Eastern and North West and Central were slightly behind their revised delivery plan targets after setting additional stretch targets in an effort to deliver more efficiencies than initially planned.
Figure 2.6: Regional contributions to efficiency improvements in CP6
Source: ORR analysis of Network Rail’s data
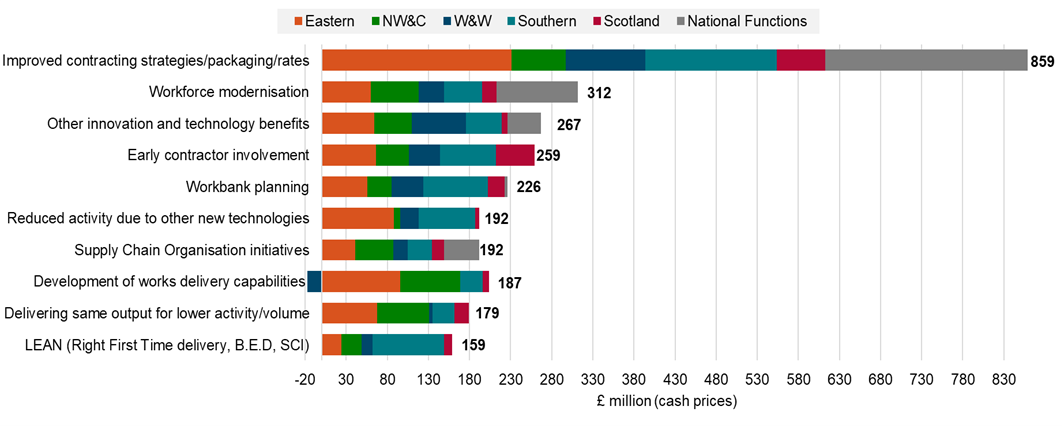
2.30 Network Rail achieved efficiency improvements in CP6 from a number of efficiency initiatives. The top ten initiatives are shown in Figure 2.7.
2.31 The number of efficiencies a region delivers depends on the type of work planned, the region's size, and its unique geography. One of the advantages of a regional structure is that Network Rail can learn from comparing the different approaches adopted by its regions.
Figure 2.7: Top ten efficiency initiatives in CP6
Source: ORR analysis of Network Rail’s data
2.32 The largest efficiency initiatives that Network Rail delivered in CP6 were:
1. Improved contracting strategies (£859 million)
Improved contracting strategies include negotiating contracts with improved terms or rates, enhancing market research and monitoring contracts more effectively. Network Rail states it has enhanced collaboration between routes and the central supply chain organisation to consolidate duplicate contracts, strengthen supplier relations and share expert knowledge.
2. Workforce modernisation (£312 million)
Workforce modernisation comprised a number of initiatives to improve the management of headcount. This included recruitment controls, continued workforce attrition, and voluntary severance schemes.
3. Other innovation and technology benefits (£267 million)
This efficiency grouping includes several initiatives aimed at modernising and improving the railway system. Some examples include the use of drones, Plain Line Pattern Recognition (PLPR) technology to detect track defects, and systems to improve asset intelligence.
4. Early contractor involvement, defined scope and minimum specification solution (£259 million)
This initiative involves Network Rail identifying opportunities to make savings through reduced scope, using minimum specification solutions and value engineering.
5. Workbank planning (£226 million)
Workbank stability is about ensuring that works which have been planned go ahead, and that fewer unplanned jobs are added to the workbank. Giving supply chains a fixed and predictable workbank should lead to improved unit rates. It might avoid peaks and troughs in activity and optimise the utilisation of constrained resources, whilst reducing rework and failures on delivery.
6. Reduced activity due to other new technologies (£192 million)
This initiative aims to lower costs by using advanced key technologies. Key elements include automation, remote monitoring, predictive maintenance using data analytics and artificial intelligence, and the use of robotics for inspections and track maintenance. These technologies reduce the need for manual inspections and maintenance, improve safety, and increase reliability, although they require significant initial investment and integration with existing systems.
7. Supply chain organisation initiatives (£192 million)
This initiative aims to make the railway's supply chain more reliable, efficient and cost-effective by improving how Network Rail buys materials, strengthening supplier partnerships, cutting costs, and ensuring that materials required for rail maintenance and upgrades arrives on time.
8. Development of works delivery capabilities (£187 million)
By developing the capability of its in-house Works Delivery teams, Network Rail has reduced its use of external contractors for some renewals activities.
9. Delivering same output for lower activity/volume (£179 million)
This initiative involved Network Rail reviewing programme deliverables to identify opportunities to reduce volume or specification without affecting outcomes.
10. LEAN initiatives (£159 million)
LEAN initiatives refer to an installation of a culture of continuous improvement. An example of this is through the ‘Better Every Day’ programme which enables, empowers, and encourages employees to make incremental improvements to their work to create value with fewer resources and with less waste.
Headwinds, tailwinds, scope changes and input prices
2.33 Network Rail analyses changes to its operations, support, maintenance and renewals costs over time through a ‘fishbone’ analysis which includes efficiencies, headwinds (unplanned cost increases due to external factors such as the COVID-19 pandemic), tailwinds (unplanned cost decreases due to external factors), scope changes (planned changes to levels of work undertaken) and input prices (inflationary effects from increases or decreases in costs above general CPI inflation).
Figure 2.8: Network Rail GB’s cost drivers in CP6
Source: ORR analysis of Network Rail’s data
2.34 Network Rail identified £481 million of headwinds in April 2023 to March 2024. The largest of these were track worker safety (£96 million), increased task complexity (£54 million) and supply chain organisation initiatives (£24 million).
2.35 Network Rail has reported £1,596 million of headwinds in CP6, which was significantly higher than its delivery plan forecast of £600 million. The main reasons for these headwinds were cost increases relating to impact of the COVID-19 pandemic (£294 million) and track worker safety (£262 million).
2.36 Throughout CP6, we reviewed reporting of headwinds and scope changes. We concluded that these were broadly being tracked and reported appropriately.
Robustness of CP7 efficiency plans
2.37 Network Rail has targeted almost £3.7 billion (2023-24 prices) of efficiency savings for Control Period 7 (CP7, 1 April 2024 to 31 March 2029), equivalent to £3.9 billion in cash prices.
2.38 The Office of Rail and Road (ORR) and Network Rail jointly commissioned Nichols Group to undertake an independent assessment of Network Rail’s preparedness to deliver its efficiency plans in the first two years of CP7.
2.39 The review considered a sample of high value efficiency initiatives within the Eastern, North West and Central, Scotland, Southern and Wales and Western regions, as well as initiatives developed centrally by Network Rail’s Route Services Directorate and Technical Authority. It entailed interviews across Network Rail’s teams and consideration of relevant documentary evidence.
2.40 Overall, Nichols’ assessment found Network Rail’s efficiency planning for years 1 and 2 of CP7 is broadly positive. Almost 80% of the initiatives sampled were already relatively mature in development terms. Two thirds of the sample had a ‘high’ level of confidence of delivery.
2.41 Nichols’ findings include that Network Rail’s July 2024 efficiency documentation demonstrates that there is a clear alignment of regional and functional efficiencies to regional delivery plans and that these, in aggregate, fully align to the CP7 efficiencies target stated in the ORR’s PR23 Final Determination. They observed that the overall framework for managing and reporting efficiencies within Network Rail is more mature than it was at the equivalent point in CP6.
2.42 Nichols highlighted a key risk management tool applied by regions is ‘over-planning’ their efficiency portfolio by targeting greater efficiency than required to meet targets in order to anticipate change if less mature initiatives are delayed, cancelled or result in lower savings. The size of this over-plan varies between regions. This over-plan is a key factor that provides confidence that the forecast for years 1 and 2 are reasonable based on current plans.
2.43 The over-plan typically comprises a large number of early-stage initiatives, so there is some inherent uncertainty on the scale of efficiency that may be realised in future. Nichols concluded that there is an opportunity for Network Rail regions to apply greater effort on these less mature plans now, early in CP7, in order to meet or even outperform targets, drive implementation of business changes that enable and unlock efficiency benefits, de-risk delivery and to mitigate the effect of potential future financial headwinds.
2.44 One recommendation Nichols made is that there could be a greater consistency in the approach to the application of over-planning and use of overlays (to take the forecast back to target), supported by suitable analytical techniques. They highlighted that the application of overlays and unidentified items may be obscuring the view of real forecasts. Nichols noted that some overlays are planned to be released at Network Rail’s delivery plan re-forecasts, RF6 (September 2024) and RF9 (December 2024), with further assurance and therefore more stability in the forecast expected to follow.
2.45 Nichols also recommended that Network Rail addresses the lower level of regional confidence in central efficiency plans (for example Route Services Directorate enabled initiatives) that are then handed over to and delivered by the regions.
2.46 Further details on Network Rail’s CP7 efficiency planning can be found in the report, which we will publish soon.
Research and development expenditure
2.47 Our PR18 determination included £245 million of funding for Network Rail to spend on research and development (R&D) activities in CP6. Cumulatively, the company has spent £238 million in CP6 delivering £208 million of efficiency improvements to date. The underspend of 3% against the PR18 determination figure was primarily driven by a small number of projects not delivering as intended over the length of the control period. These projects were as a result removed by Network Rail as part of good governance practice of the R&D fund to ensure investments continue to generate a benefit.
2.48 Over 100 projects have started since the beginning of CP6, with 15 deploying on the network to date, generating approximately £208 million of efficiency savings. While this shows early signs of the programme's success, its long-term effectiveness will depend on continued engagement with routes and regions to ensure the potential benefits of projects are recognised, ultimately leading to their deployment in those routes.
Projects include:
(a) Plain line pattern recognition deep learning
Plain line pattern recognition (PLPR) has delivered vast improvements to visual inspection of plain line track. However, nearly half of the 130,000 periodic incidents turn out to be false positives, such as debris. This project developed and deployed a new algorithm to improve the detection of actual incidents, increasing the efficiency of the inspection.
(b) Cast crossing developments
Failures of cast crossings cause disruption and are costly. However, their design has not changed in decades. This project developed a new set of cast crossings based on an improved understanding of rail/wheel connected forces as well as increasing the strength in the castings to withstand increasing pressure from passing trains.
(c) Flow Bridge
New style of footbridge using fibre-reinforced polymer, known as FLOW, was developed and implemented after calls to improve safety at level crossings and the need to find alternatives to standard, heavy steel footbridges. These bridges have an in built monitoring system to record how they perform and are used for more efficient maintenance and future improvements to design.
2.49 Third party funding is used to support the R&D programme alongside the direct funding of £245 million set at PR18. Network Rail secured an additional £109 million of third party funding over the control period, 3% less than the CP6 target of £112 million. Whilst the use of third party funding can generate cost savings, these are not recorded as part of routes’ and regions’ efficiency savings.
2.50 Whereas there was a greater focus on a long term return period in CP6, for CP7, Network Rail has stated that it will be putting more emphasis on returns in the control period, which we support. Network Rail’s delivery plan for CP7 includes a forecast of £143 million of R&D expenditure.
2.51 Network Rail has stated it will focus on developing a structured partnership with other domestic organisations to solve innovation challenges in an effort to seek greater efficiencies. This partnership approach should help to secure additional third party funding. It is important for Network Rail to take advantage of these types of opportunities, but the company must ensure that it prioritises project rollout throughout its regions.
Performance Innovation Fund
2.52 At PR19, we established a £40 million Performance Innovation Fund (PIF) for CP6 (in 2018 prices) designed to support innovative ways to drive performance improvements. Investments through the scheme were slow in the early years of the control period. Network Rail implemented a recovery plan to address our concerns. This plan delivered targeted interventions which increased the rate of investment made.
2.53 Throughout the remaining years of the control period, investment increased with a total of £39 million invested by the end of CP6. North West and Central made the largest regional investment of £10.5 million. The other four regions’ combined total investment was £17.6 million with the remainder invested by Network Rail’s national functions.
2.54 For CP7, Network Rail has a Performance Improvement and Innovation Fund (PIIF) worth £40 million (2023-24 price) which we set out in our PR23 determination. Given the importance of addressing train performance issues in CP7, we would expect the CP7 PIF to be fully utilised. We will monitor Network Rail’s delivery of this through CP7.
Risk funding
2.55 Network Rail received £3.0 billion of risk funding (cash prices) in CP6. Going into year 5 of CP6, Network Rail had no unallocated risk funding available to manage unforeseen risks. Network Rail had used up its CP6 risk funding in the first four years of the control period to manage risks associated with the COVID-19 pandemic, industrial action, severe weather conditions and inflationary pressures.
2.56 In April 2023 to March 2024, Network Rail managed its risk by reprioritising workbanks and reducing the scope of its renewals to manage increasing costs. Throughout the year we worked with Network Rail in monitoring its reprioritisation of workbanks, how the company minimised any safety concerns and how it managed the implications on asset efficiency and sustainability.
2.57 The challenges in CP6 and the new governance arrangements in place for the use of its risk fund in CP7, highlight the importance of allocating funding appropriately to efficiently manage unforeseen financial risks over a five-year control period. Our PR23 final determination set out that Network Rail should set aside £1.7 billion (2023-24 prices) of risk funding (£1.5 billion for England and Wales and £0.2 billion for Scotland). We are aware of mounting pressures on CP7 funding so will continue to monitor Network Rail’s use of risk funding throughout CP7.
Budget flexibility
2.58 Network Rail is classified as an arm’s length public sector body which means that it is subject to the Government’s resource (operating) and capital departmental expenditure limits (‘RDEL’ and ‘CDEL’). These expenditure limits restrict Network Rail’s ability to spend money in different years of a control period than initially agreed. The expenditure limits also restrict switching of expenditure between resource and capital expenditure. The budget flexibility rules for CP6 are quite complicated and were explained in our PR18 financial framework document.
2.59 Network Rail was not able to roll over any capital budgets into the next financial year. This is because there was no underspend on capital expenditure.
2.60 Oversight of the flexibility of grant payments within Scotland falls within the remit of Transport Scotland (TS) and the Scottish Government’s budget flexibility process. We cover this in Chapter 3 of this report.
Regulatory finances
2.61 Network Rail’s regulatory asset base (RAB) increased by £3.1 billion to £87.6 billion in the year April 2023 to March 2024. The increase was due to indexation plus renewals added to the RAB offset by the amortisation of existing assets and a £162 million deduction for property sales.
2.62 Network Rail no longer issues debt to fund its capital expenditure. However, it continues to hold legacy debt (£58.2 billion), including financial instruments issued to investors before the company’s reclassification to the public sector. Network Rail’s current gearing (net debt over RAB) is at 68%.