ORR’s role is to hold National Highways to account to deliver the road investment strategy (RIS). The Performance Specification forms part of the RIS. It is published by the Department for Transport (DfT) and sets out what it expects National Highways to deliver in the road period. For the second road investment strategy (RIS2) it includes 12 key performance indicator (KPI) targets covering the outcome areas of:
- improving safety for all;
- providing fast and reliable journeys;
- a well maintained and resilient network;
- being environmentally responsible;
- meeting the needs of all users; and
- achieving efficient delivery.
These are supported by a suite of performance indicators (PIs), detailed in the Operational Metrics Manual. This chapter sets out National Highways’ performance against all of its KPIs, and selected PIs where stakeholder interest is greatest. Data for all KPIs and PIs, are published on our website.
Performance overview
In the reporting year, 1 April 2023 to 31 March 2024, National Highways met three of its four in-year KPI targets, on pavement condition, incident clearance and roadworks network impact, but missed its in-year target for road user satisfaction.
Currently National Highways is at risk of not meeting some of its performance commitments for the end of the second road period (RP2). We foresee the company to be below target or off-track for four of its 12 KPIs. These are:
- the number of people killed or seriously injured on the strategic road network (SRN);
- average delay;
- National Highways’ carbon emissions; and
- roadworks information, timeliness and accuracy.
We also believe that it will be challenging for National Highways to maintain current levels of road user satisfaction in the final year of RP2.
The company is seeking to change the targets for three KPIs (roadworks network impact; roadworks information timeliness and accuracy; and efficiency) and set a target for one other (road user satisfaction) to ensure its performance specification remains challenging and deliverable in the final year of the road period. Any changes to KPIs are subject to decision and approval by government. Even if the changes proposed by the company are agreed, it will need to make a concerted effort to achieve these targets by the end of the road period.
Improving safety for all
KPI: number of people killed or seriously injured on the SRN
In December 2023, we published our second annual assessment of safety performance on the SRN. We reported that National Highways has achieved a 38% reduction in the number of people killed or seriously injured (KSIs) on the SRN compared to a 2005 to 2009 average baseline, as shown in Figure 2.1. We highlighted that, despite the longer-term downward trend in KSIs, the company was not on course to achieve the safety KPI target by the end of December 2025. As a result, we required it to produce a robust plan by the end of March 2024 setting out how it aims to meet the target.
Figure 2.1 Killed or seriously injured (adjusted) and traffic on the SRN, annual data, 2005 to 2022
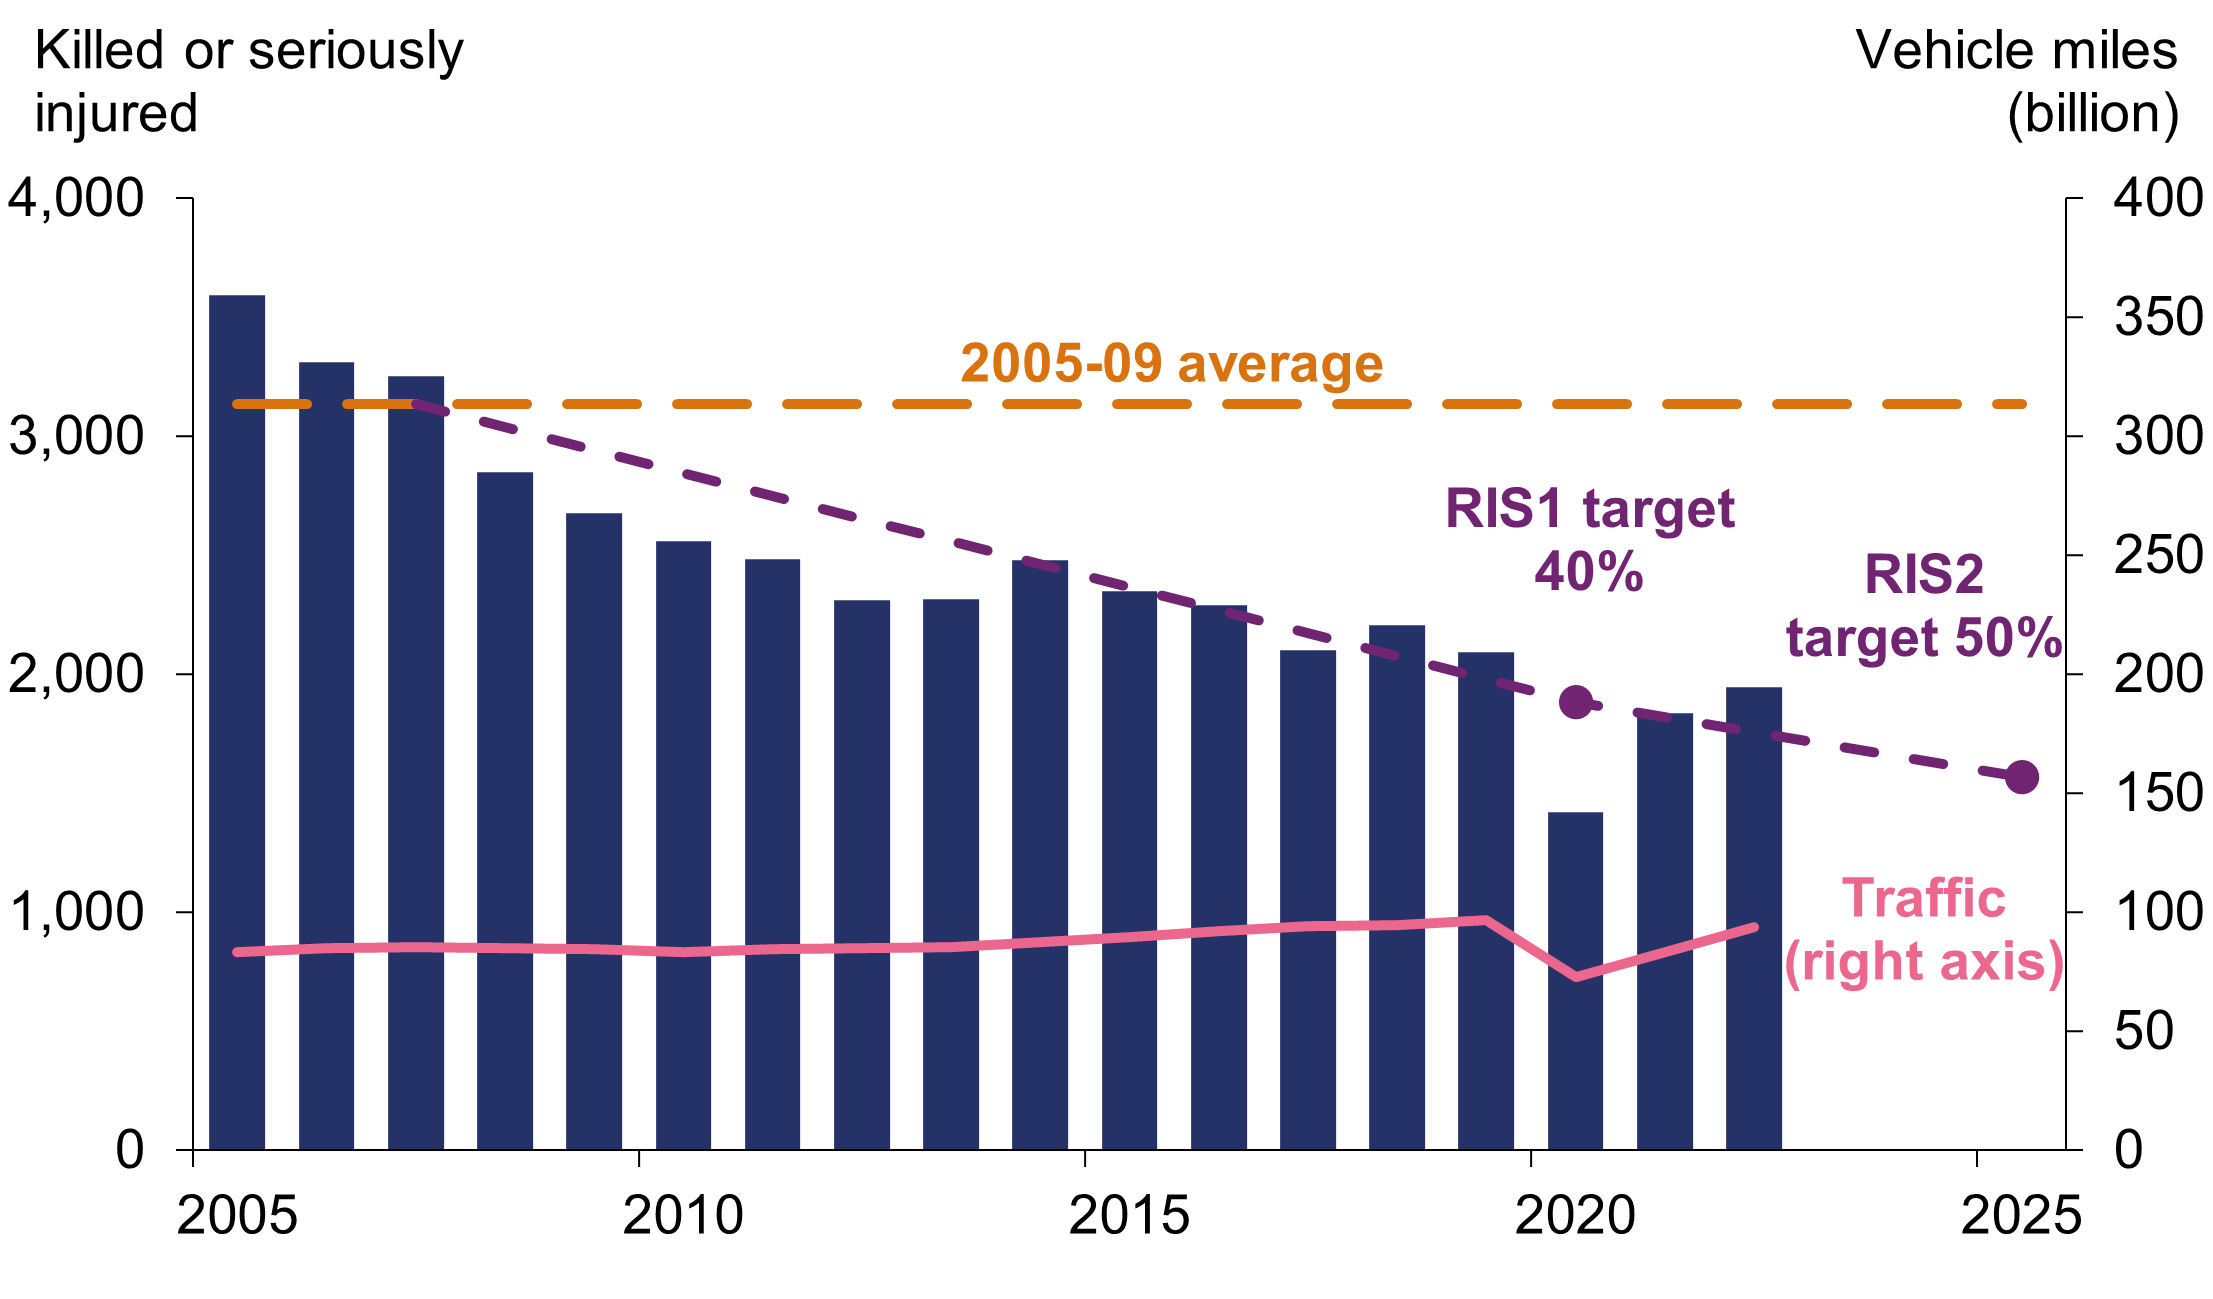
Source: ORR’s second annual assessment of safety performance on the SRN
National Highways provided us with an enhanced safety plan in March 2024, setting out the additional actions it will take that go beyond its previously planned activities. This includes 43 targeted actions, covering road safety schemes, communication campaigns, and working with other road safety stakeholders with the aim of supporting delivery of its 2025 target.
While we consider that National Highways is doing everything it can in the final year of RP2 to achieve the safety target it is our assessment that it is improbable that these actions will deliver a sufficient reduction in KSIs to achieve the RIS2 target.
In our previous assessments of National Highways’ performance, we consistently raised the issue that there was a risk to achieving this target as traffic levels increased following the coronavirus pandemic. While we recognise that not all the actions to reduce KSIs on the SRN are fully within the company’s control we believe that if National Highways had been more proactive in recognising the risks earlier in the road period and developed more robust safety plans sooner this would have increased the likelihood of meeting the target.
Road casualty statistics for 2023 are due to be published by DfT in September 2024. These will inform our assessment of National Highways’ progress against the safety KPI in our next annual safety report, to be published before the end of March 2025. This will also include an update on our work in relation to recommendations 4 and 6 from the Transport Select Committee’s inquiry into the rollout and safety of smart motorways. Through this work we continue to scrutinise the company’s progress in optimising the performance of technology on smart motorways, including how it can better understand and address the reasons for issues that affect availability of the technology, such as power outages.
Providing fast and reliable journeys
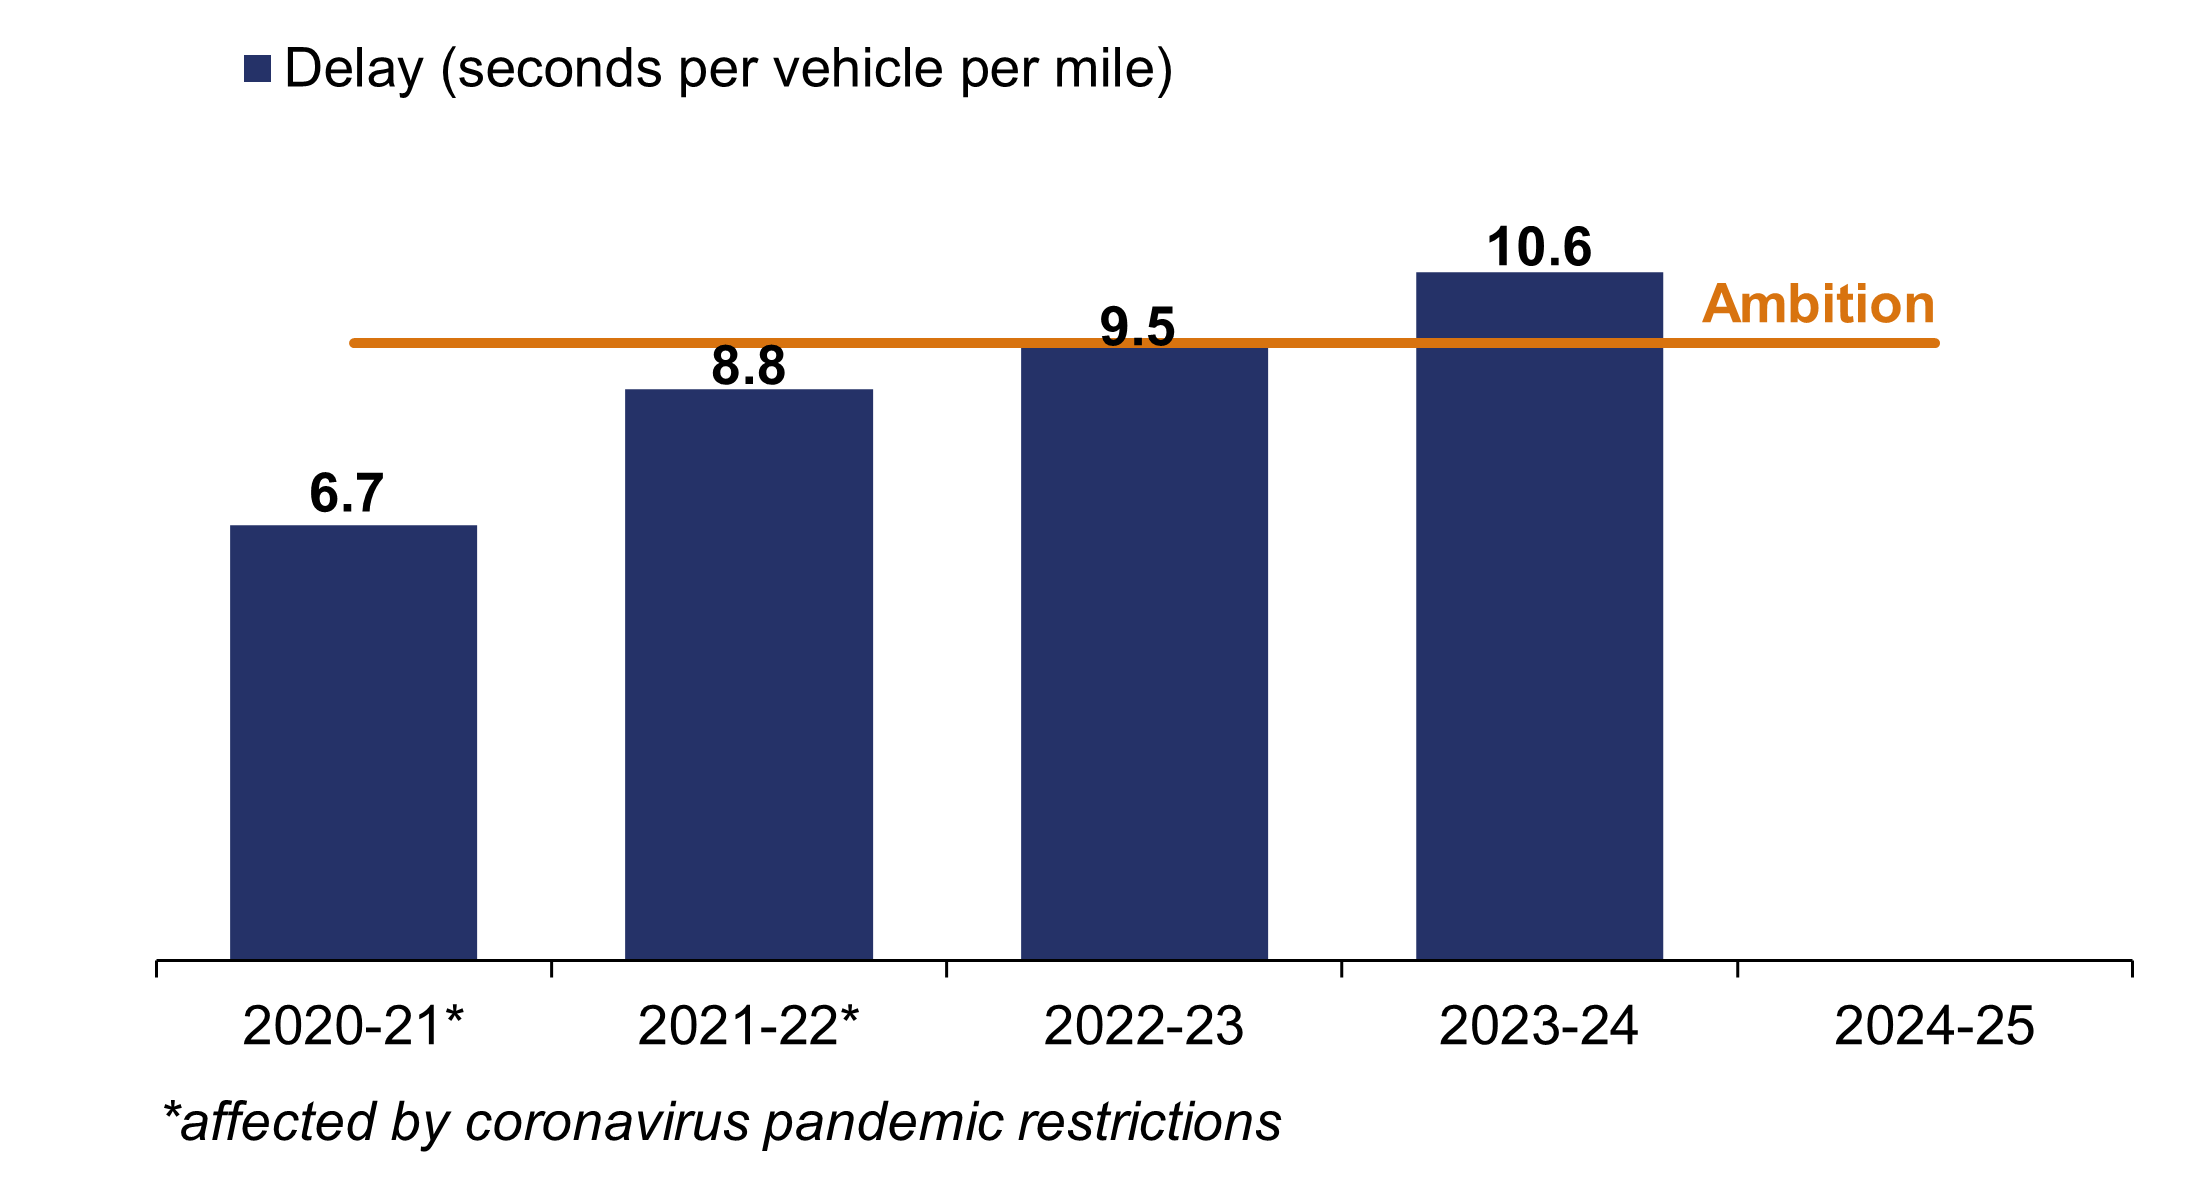
KPI: Average delay
Transport Focus’ research has shown that journey time is the most important influence on satisfaction among drivers. It is often even more important to logistics and bus and coach businesses. Whilst journey time can be influenced by factors outside of National Highways control, such as traffic growth, it can and should work to tackle factors within its control such as: roadwork management and how it deals with incidents, minimising delay to road users.
In the reporting year, average delay on the SRN was 10.6 seconds per vehicle per mile (spvpm). National Highways’ ambition for delay is that it should be no worse at the end of RP2 than at the end of RP1. However, as shown in Figure 2.2, average delay at the end of March 2024 is 1.1 spvpm worse than in February 2020, immediately before the coronavirus pandemic.
ORR has challenged National Highways to explain why average delay has increased over this period despite traffic levels being similar. The company continues to investigate this but has been unable to determine the causes of the increase.
National Highways continues to deliver its delay action plan, with initiatives to reduce incident clearance times, the impact of roadworks and address congestion. The company expects delay to increase further in the final year of RP2 due to the impact of the National Emergency Area Retrofit (NEAR) programme on smart motorways but is unable to quantify the impact on users. It is important that National Highways increases its understanding of delay data so it can better understand the scale of impact of its interventions and can more effectively prioritise the actions it takes to reduce delays on the SRN in the final year of the road period.
Figure 2.2 Average delay KPI, annual data, April 2020 to March 2024
KPI: Roadworks network impact
This KPI incentivises National Highways to mitigate the impact of roadworks for road users by keeping lanes open, or using higher speed limits where it is safe to do so. It measures the impact of roadworks on the SRN based on: the length of roadworks, the amount of time they are in place, the number of lanes affected and any width or speed restrictions applied.
In the reporting year, roadworks network impact averaged 43.1 million lane metre days, against National Highways’ in-year target to keep below 48 million lane metre days. Originally it was agreed with government that the target would increase in the final years of RP2 due to more enhancement schemes expected to be in construction. However, there are now fewer enhancements in construction than originally planned. Therefore, in Year 3, ORR advised the company and DfT to recalculate the target to ensure it was appropriately stretching in the final two years of the road period. In Year 4, DfT instructed National Highways to recalculate the target for Year 5.
National Highways expects the impact of roadworks on the network to increase in the final year of the road period. While there will be fewer enhancements in construction than originally planned, the company expects performance to decrease due to the National Emergency Area Retrofit (NEAR) programme, but it is unable to quantify the impact on the KPI. As a result, National Highways has proposed increasing the target in the final year of RP2. This change is subject to government decision. Changes to target levels should ensure they incentivise National Highways to reduce the adverse impact of roadworks on users.
KPI: Incident clearance rate
National Highways’ RIS2 outcome of providing fast and reliable journeys on the SRN is supported by a target to clear incidents on motorways in a timely manner. This KPI reports the proportion of motorway incidents affecting traffic flow cleared in under an hour. The company has consistently performed better than target over the road period. In Year 4 it cleared 87.8% of incidents affecting traffic flow on its motorways within one hour. This is better than its target of 86% and an improvement on the rate in the previous year (87.2%).
This has been achieved while the volume of incidents on the network increased by 10% in the latest year, to 93,796 incidents in Year 4 of RP2 compared to 84,231 incidents in Year 3. This shows an improved ability by the company to handle more incidents on the network whilst clearing a greater proportion within one hour.
National Highways has consistently exceeded the target throughout the year, with no single month dropping below 86%. The company attributes this improved performance to optimised patrol strategies and the introduction of a ‘single view of the network’ that enables traffic officers and staff in control centres to access key network information through a single platform. National Highways should continue to actively review its performance to ensure it can continue to optimise its patrol strategies and operational processes to maintain performance.
A well maintained and resilient network
KPI: Pavement condition
Maintaining the SRN is a key component of meeting customer expectations. Efficient maintenance and renewals delivery minimises disruption for road users.
National Highways met its in-year target of 96.2% of pavement (road surface) in good condition with 96.2% of the pavement meeting the requirements by the end of March 2024. Figure 2.3 shows the performance in the reporting year.
Figure 2.3 Pavement condition KPI, percentage points (pp) above or below target, monthly data, April 2023 to March 2024
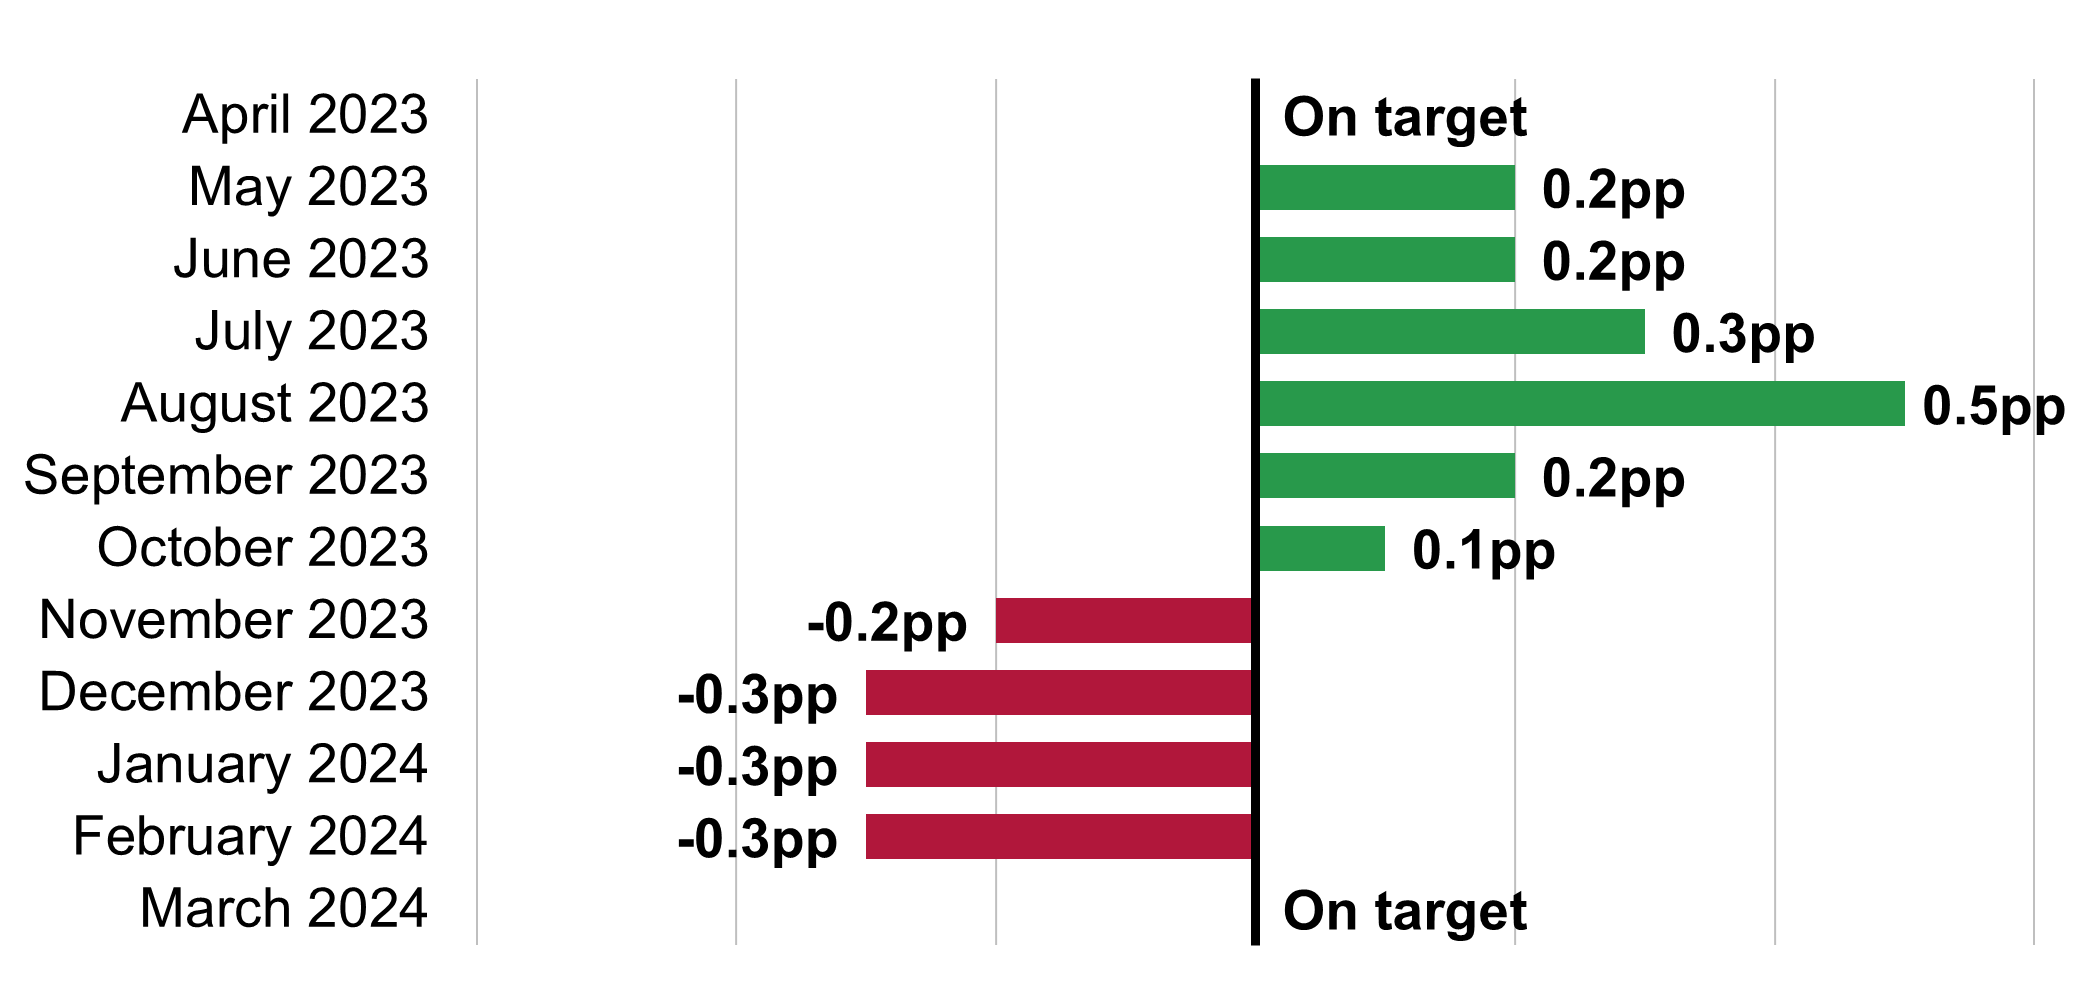
In November 2023, National Highways reported that performance had dropped below 96.2% and continued to forecast each following month that the target would not be met by year-end. From November 2023 onwards, we worked closely with the company to understand the root causes of the issue and the company’s plans to improve its performance. The company chose to adopt a strategy to try and meet the target by the end of RP2 and stated it would continue to seek opportunities to deliver KPI impactful renewals in Year 4.
It is good that National Highways ultimately met its in-year target. However, the company was uncertain during the reporting year if it would succeed, which mirrors the situation we encountered in the previous year. We will continue to work closely with the company to understand how it met its in-year target, in particular in balancing its competing priorities, and what improvements it can make to its future predictions to provide better assurance of its ability to achieve its committed target.
PI: Technology availability
The availability of technology, such as variable message signs and signals, on the SRN is a high priority for road users. This performance indicator (PI) measures the percentage of time that roadside technology services are available and functioning.
Technology availability on the SRN as a whole has reduced to 91.4% in Year 4 compared to 95.3% in Year 3. This is the worst performance in RP2 so far. National Highways’ progress in relation to technology availability on the SRN and our next steps are described in more detail in the Operations, maintenance and renewals chapter. It should be noted that the availability of technology on smart motorways is reported separately in our annual assessment of safety performance on the SRN.
Being environmentally responsible
KPI: Corporate carbon emissions
National Highways is required to support the Greening Government Commitments, a set of actions UK government departments and their agencies will take to reduce their environmental impact. As part of this, the company has a KPI target to reduce its corporate carbon emissions by 67% by the end of RP2, compared to an April 2017 to March 2018 baseline.
At the end of March 2024, National Highways is off-track to meet its target to reduce its corporate carbon emissions by the end of RP2. The company is forecasting it will achieve a 65% reduction by the end of RP2. The gap between its forecast position and target is equal to 1,360 tonnes of CO2, or 15,173 petrol car journeys from London to Glasgow.
Figure 2.4 shows that National Highways emitted 45,266 tonnes of carbon dioxide equivalent (CO2e) in Year 4 of RP2. This is a 50% reduction compared to the April 2017 to March 2018 baseline, but 457 tonnes worse than in Year 3. The company reported higher electricity usage, business travel and traffic officer mileage led to worse performance than it had forecast this year.
Figure 2.4 National Highways’ carbon emissions forecast (tonnes of CO2 equivalent), March 2024
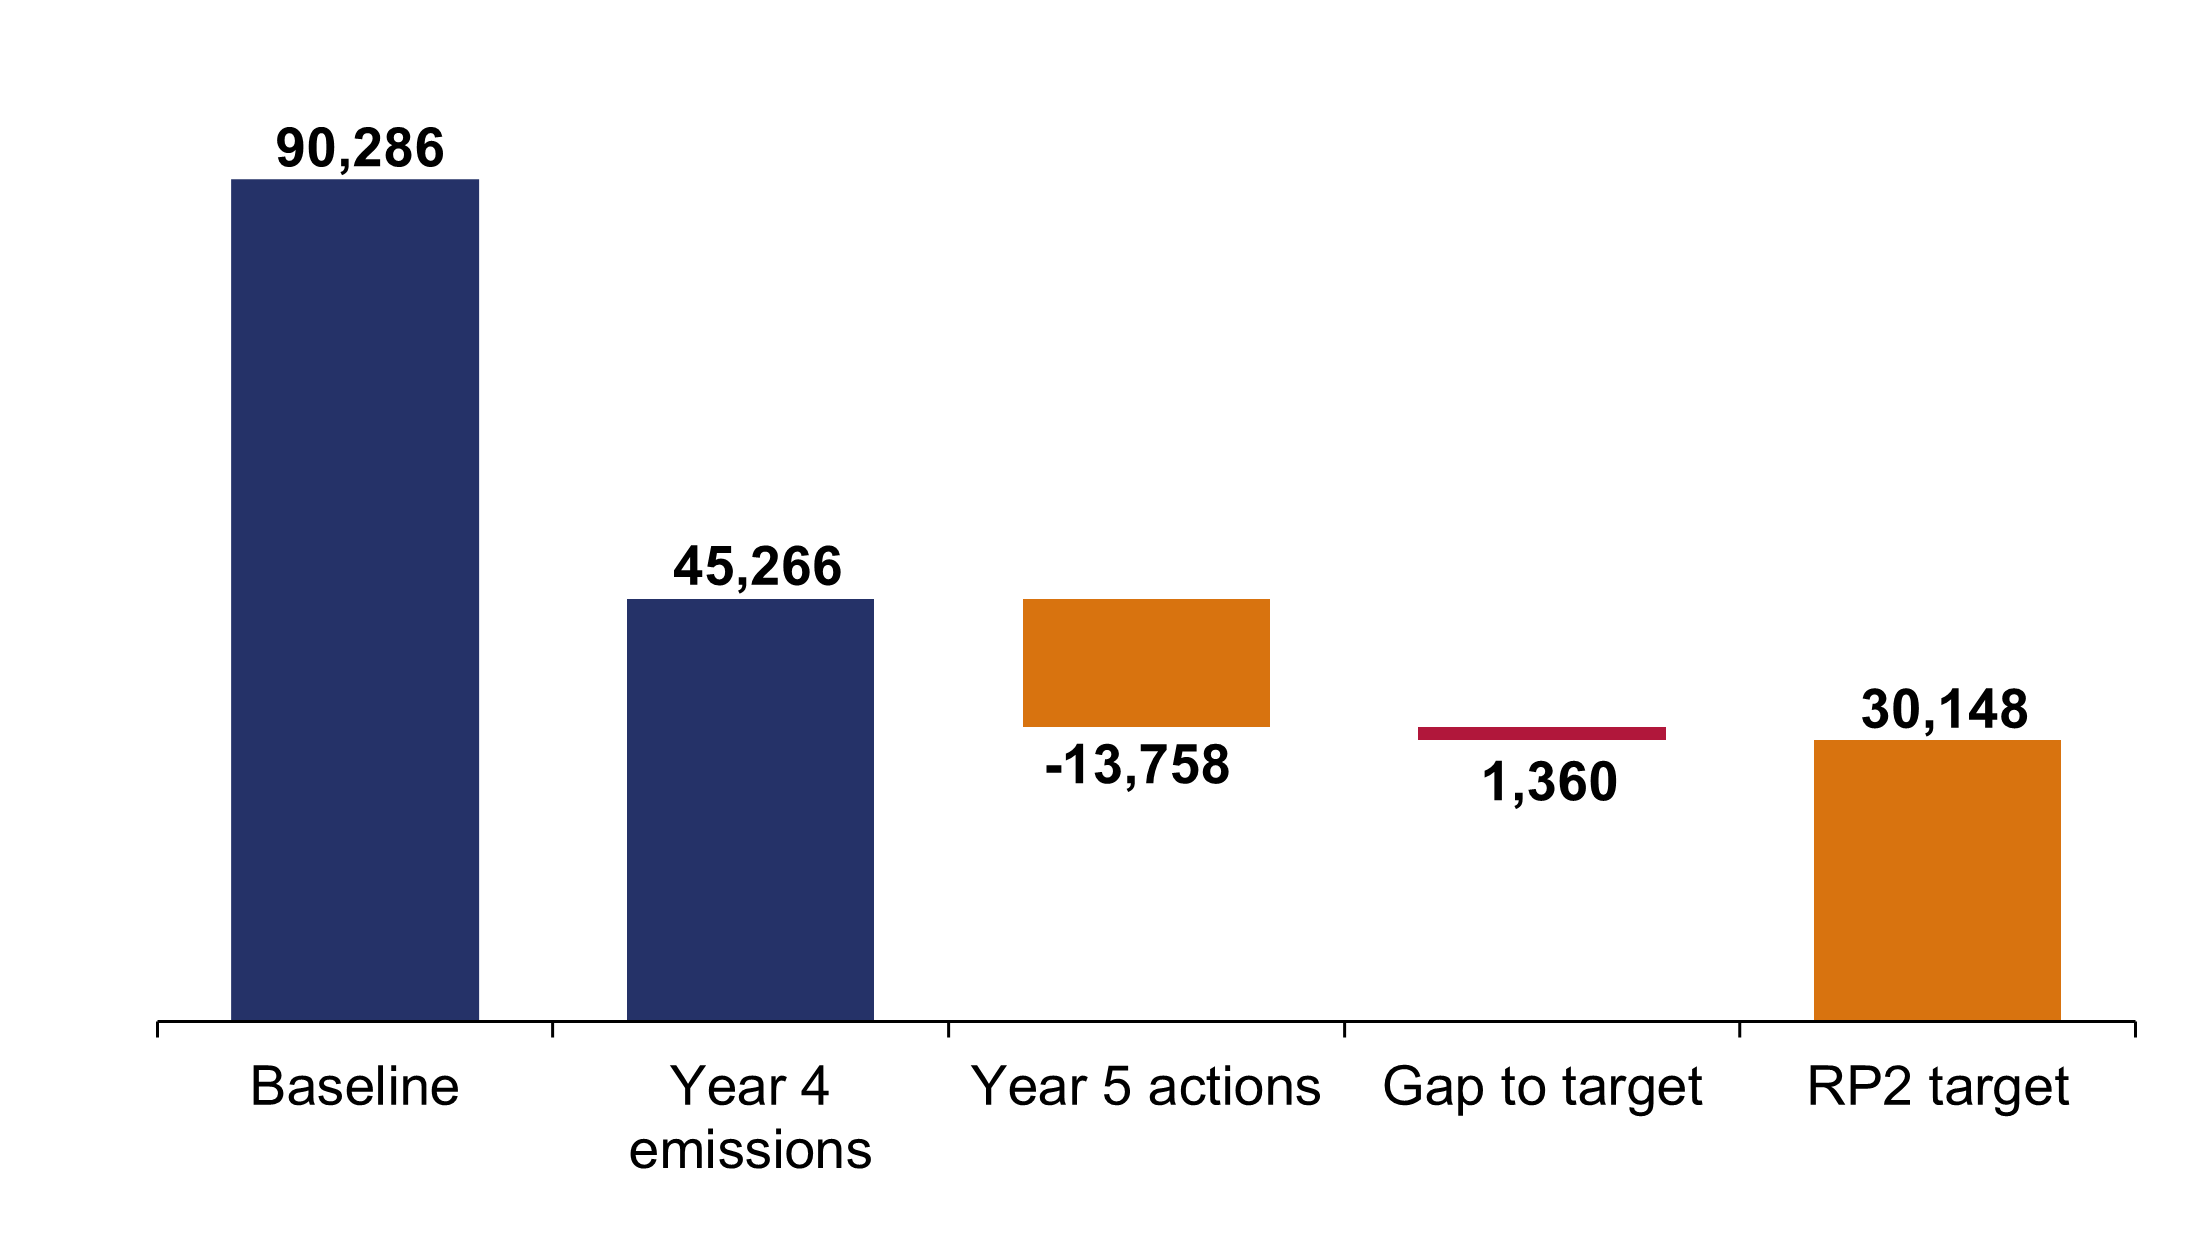
Electricity usage is the biggest contributor to National Highways’ carbon emissions. At the end of March 2024, the company reduced its electricity use by 17% compared to its April 2017 to March 2018 baseline, behind its forecast for a 18% reduction by March 2024.
In January 2024, we required National Highways to set out a plan for how it intended to address the gap to its committed target, including additional actions or accelerating existing actions to reduce carbon emissions. The company identified some additional actions, but their impact is not expected to be sufficient to close the gap.
The single biggest action National Highways is taking to reduce its carbon emissions is its programme to install more LED lighting on the network. We challenged the company to accelerate its LED programme to achieve its carbon KPI target. National Highways claimed this would require additional renewals funding and lane closures that would have a detrimental impact on road users. We requested evidence to support the company’s decision to not accelerate the rollout of LED lighting, which it has yet been unable to provide.
We continue to challenge the company to provide more robust evidence to support the decisions it has made, and blockers to achieving the target. This is particularly important as this commitment is likely to become more challenging in the next road period if it is to achieve its Net Zero plan.
KPI: Air quality
Government identified 128 sections of the SRN that may exceed legal limits for nitrogen dioxide, a pollutant common in vehicle exhaust emissions. In RP2 National Highways must bring nitrogen dioxide levels on these sections into legal compliance in the shortest time possible.
Following publication of National Highways’ latest air quality report in January 2024, the company has 30 sections which exceed the legal limit for nitrogen dioxide. This is a reduction from 43 sections reported in our last annual assessment. Of the 43 sections, 25 sections remain above the limit value and 18 sections are now compliant. Monitoring data in 2022 has highlighted five additional sections are exceeding legal limits.
For nine of the 30 sections that exceed legal limits, National Highways has considered all potential measures to improve air quality, such as emission controls on buses, speed limits, traffic management measures and pollution barriers. DfT wrote to the company in September 2021 to accept that these sections have no viable additional mitigation that the company can implement. The letter set out a monitoring regime that the company must follow for each of these sections.
National Highways is designing and implementing air quality improvement measures for the remaining 21 sections, including working with local authorities on joint measures. The company has air quality improvement measures on five sections already, and it is working to identify appropriate measures for the remaining 16 sections. The company appears to have made reasonable progress to date in delivering its obligation on air quality.
KPI: Biodiversity
Biodiversity is the variety of animal and plant life, with a vital role in sustaining our natural environment.
A biodiversity unit is linked to the size, condition and location of a habitat or piece of land. In 2020, National Highways calculated that across its estate it has 130,848 biodiversity units. This covers all the company’s land, including verges either side of the carriageway.
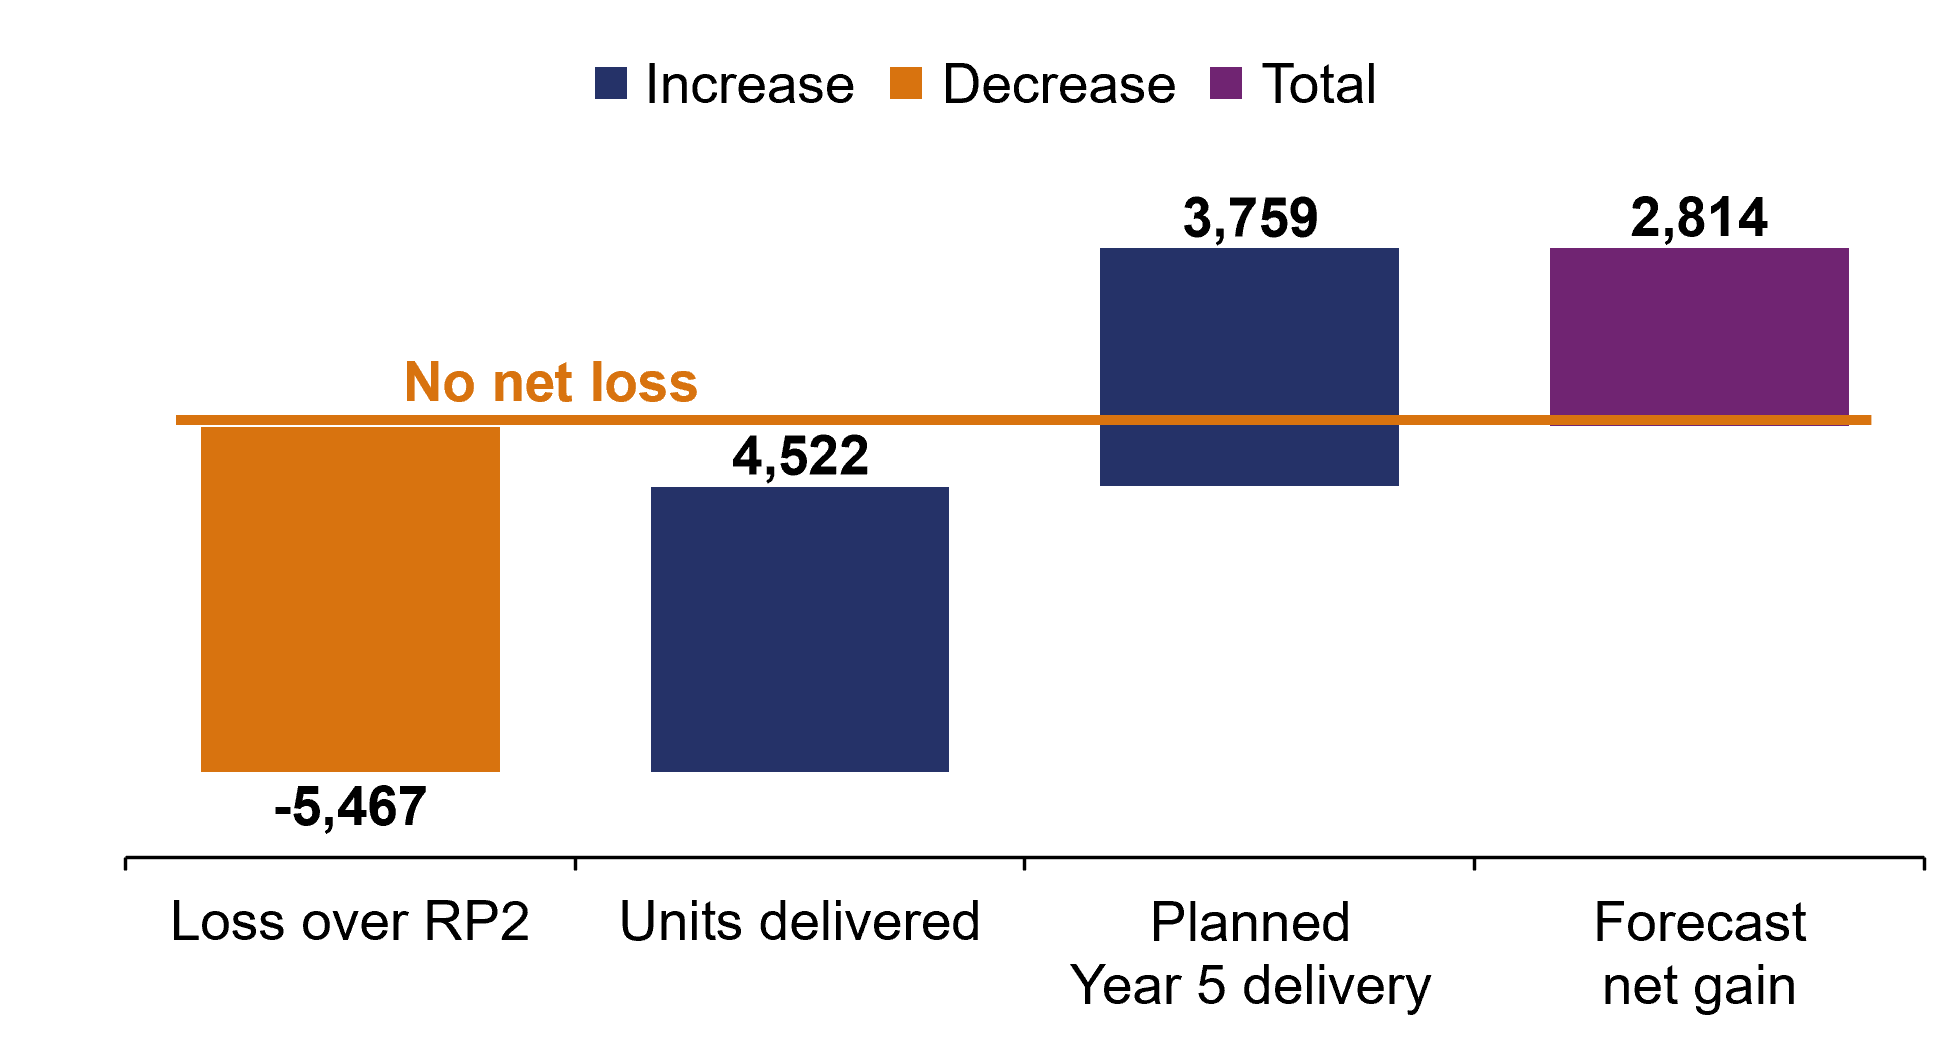
National Highways has robust plans in place to meet its KPI target to deliver no net loss in biodiversity by the end of RP2. At the end of March 2024, the company forecast a net gain of 2,814 biodiversity units for the end of the road period. This only includes funded projects with a high confidence of delivery in the final year of RP2. National Highways responded well to our challenge earlier in the road period, when it was forecasting to miss its target, by developing and delivering a substantial pipeline of biodiversity schemes.
To determine the number of units the company needs to deliver to achieve no net loss, it estimated the biodiversity loss from all enhancement schemes planned to start work in RP2, alongside an assumed 1% deterioration each year across its estate. This deterioration accounts for loss from day-to-day renewals, maintenance activities and the operation of the network, such as noise and air pollution.
As shown in Figure 2.5, National Highways estimated that without any additional biodiversity mitigation there would be a loss of 5,467 biodiversity units over RP2. In the reporting year, National Highways delivered 2,400 biodiversity units. This takes the total biodiversity units delivered by the company, since April 2020, to 4,522 units. Therefore, the company is required to deliver 945 biodiversity units in the final year.
The company has funded projects expected to deliver up to 3,759 biodiversity units in the final year of RP2. This follows challenge from ORR to develop a pipeline of projects to achieve the RIS2 target. There has since been delays to enhancement schemes that the company was to deliver and, as a result, there will be less biodiversity loss than was originally estimated for RP2. Therefore, National Highways is on track to achieve a net gain in biodiversity, in excess of its no net loss RIS2 target.
Figure 2.5 National Highways’ biodiversity KPI forecast (biodiversity units), March 2024
KPI: Noise
Households on or near the SRN experience substantial noise pollution, mostly from vehicle tyres and engine noise. National Highways has a programme to mitigate noise, through either laying lower noise surfacing, upgrading insulation in affected households or installing noise barriers.
National Highways has a KPI target to mitigate noise from 7,500 households by the end of RP2. In the reporting year it has mitigated noise for 990 households, as shown in Figure 2.6. Since the start of RP2, the company has mitigated 5,197 households. This is 69% of its target of 7,500 by the end of the second road period. It will need to deliver a further 2,303 mitigations in the final year of RP2 to meet its target.
Figure 2.6 Noise KPI, annual data, April 2020 to March 2024
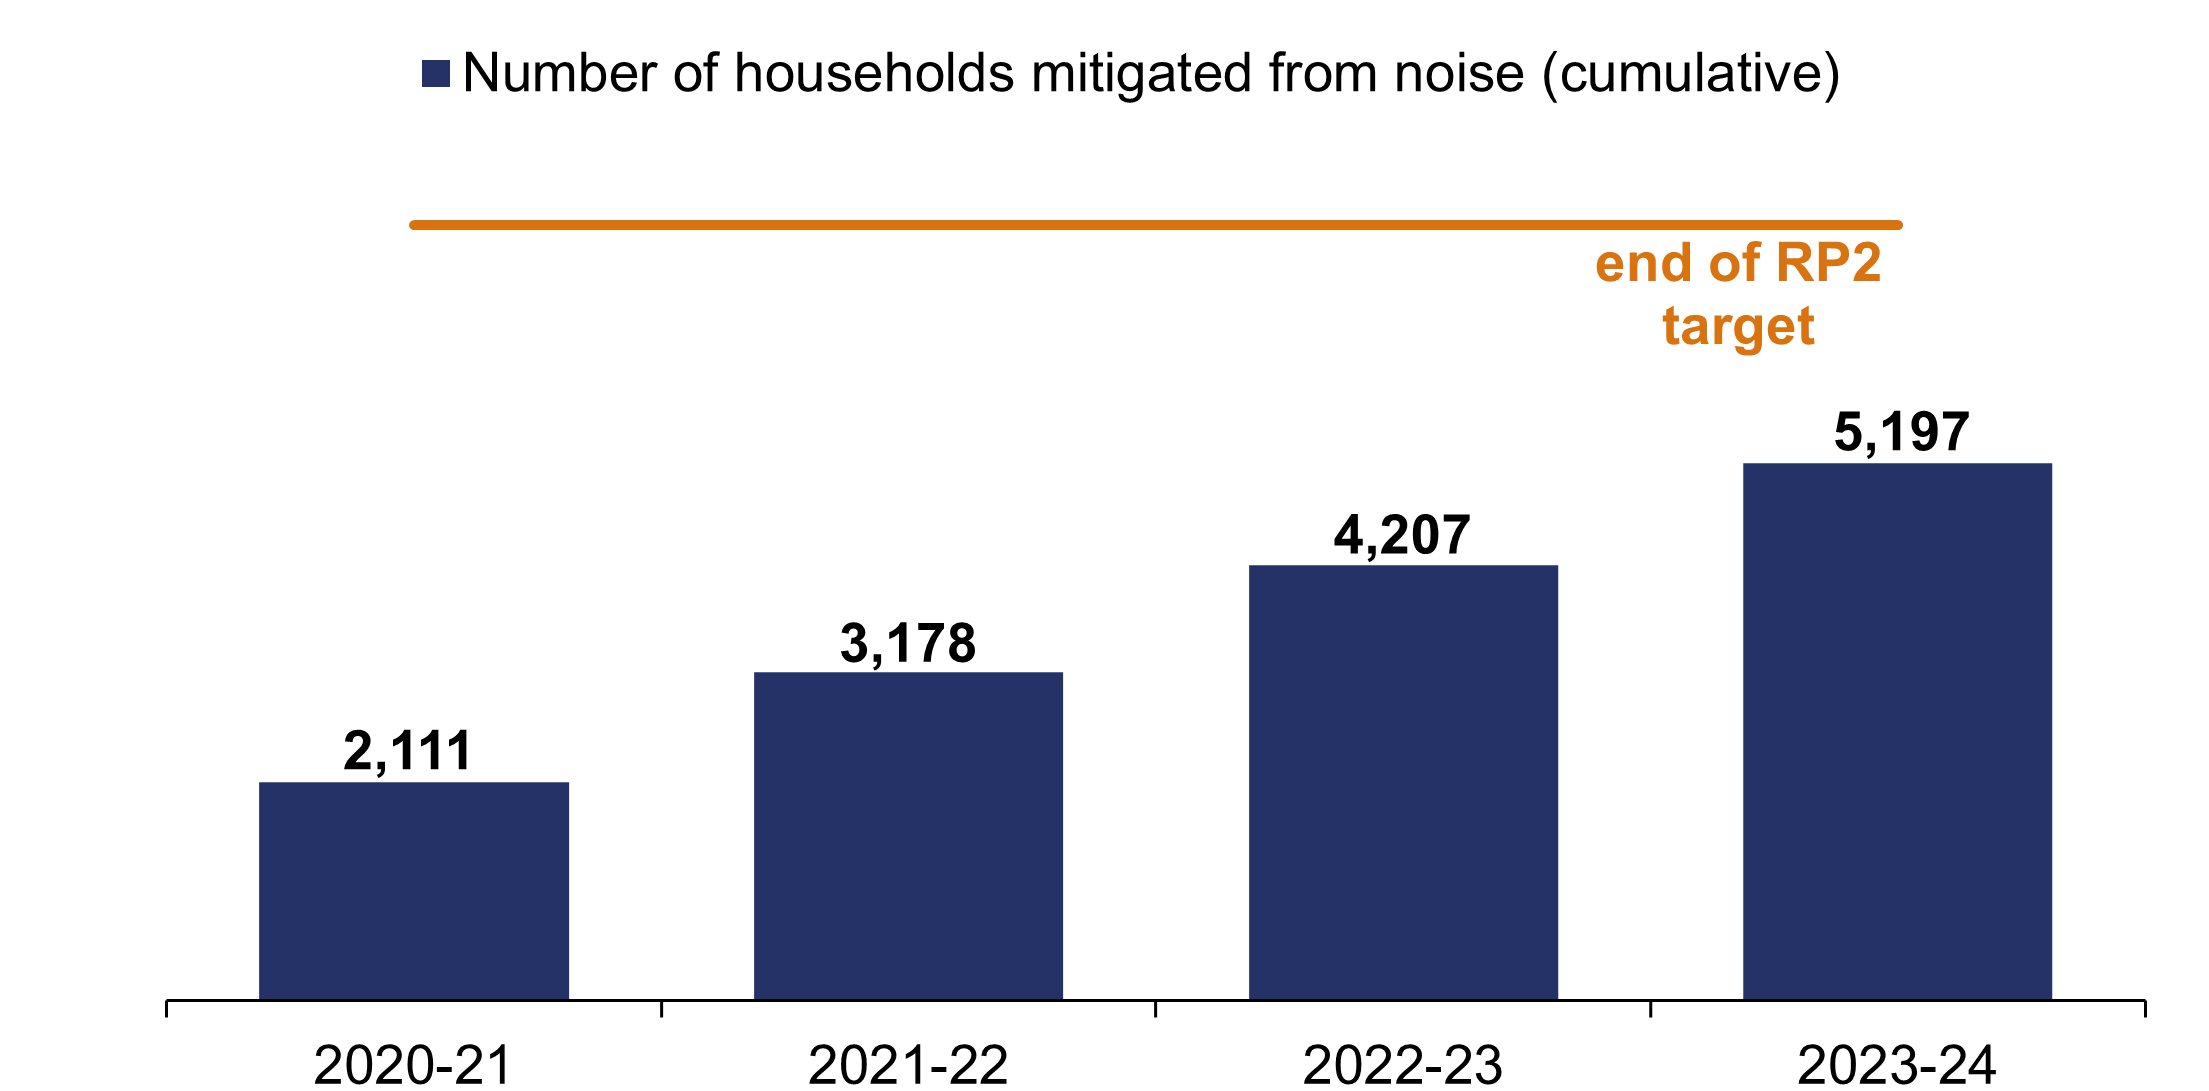
National Highways has identified 2,431 mitigations that it has high confidence of delivering in the final year of RP2. This would achieve its end of RP2 target but leaves little contingency if there are delays to installing these identified mitigations. We will closely track delivery throughout the final year of RP2 to ensure the company focusses on meeting its target.
PI: Litter
Litter is a concern for road users and the public. It is the responsibility of National Highways and Local Highways Authorities to clear litter from the SRN and work with stakeholders to reduce levels of littering, as explained in the company’s litter strategy. We report the level of litter on the network through National Highways’ litter PI, which is untargeted, however the company has responsibility for collecting litter under the Environmental Protection Act 1990.
In the reporting year, National Highways surveyed the SRN and reported that 59.2% of the network was rated at Grade A or B according to Defra’s litter code of practice. This was better than 53.6% of the network in the previous reporting year being free of litter or predominately free of litter and refuse apart from some small items, as shown in Table 2.1.
Table 2.1 Litter PI, annual data, April 2020 to March 2024
| Reporting year | Percentage of SRN free of litter or predominately free of litter and refuse apart from some small items |
|---|---|
| April 2023 to March 2024 | 59.2 |
| April 2022 to March 2023 | 53.6 |
| April 2021 to March 2022 | 60.8 |
| April 2020 to March 2021 | 49.2 |
Source: National Highways
The two regions that performed worst against the litter PI were the East and Midlands regions, with 43.6% and 42.6% free or predominately free of litter respectively. The North West performed best, with 81.4% of its network free or predominantly free of litter.
The range of scores between different regions highlights the need for National Highways to share best practice between its regional teams to drive improvements at a national level. We will continue to challenge the company on the actions it is taking to address litter on the SRN and that it is sharing lessons learnt between regions.
Meeting the needs of all road users
KPI: Road user satisfaction
The Strategic Roads User Survey (SRUS) measures users’ satisfaction with a single journey on one road of the SRN within the last 28 days. The online survey, managed by Transport Focus, measures different aspects of users’ journeys including their overall satisfaction.
In the reporting year, National Highways missed its in-year road user satisfaction target, for at least 73% of users to be fairly satisfied or very satisfied with their journey on the SRN and reported a 12-month rolling average of 71% of users satisfied.
National Highways’ target was set using ten months of data following a pause in the survey and a change in its methodology, from face-to-face to online, as a result of the coronavirus pandemic. Government agreed to review the target once a longer time series of data was available. An updated target level for the final year of RP2 has been proposed by National Highways and is subject to government decision. We recommend that any changes to targets should remain challenging and deliverable and ensure the right outcomes for users.
To enable improvements in road users’ satisfaction National Highways has a customer service plan. This includes 37 initiatives to deliver in the reporting year to improve road user journeys. The company delivered 34 of the planned initiatives. Two outstanding initiatives on roadside facility signage and variable signs and signals set for incidents will be delivered in Year 5 of RP2, due to delays resourcing design development and updating road traffic control software, respectively. One initiative, on energy storage systems, will not be fully delivered in RP2 due to delays obtaining grid connections.
National Highways' analysis of SRUS data shows that increasing levels of delay on the SRN negatively affect road user satisfaction. Therefore, the company anticipates that it will be challenging to maintain current levels of satisfaction in the final year of RP2 as the NEAR programme is expected to lead to higher levels of delay. We will continue to challenge the company to evidence how it is improving delay on the SRN and deliver initiatives to improve user satisfaction.
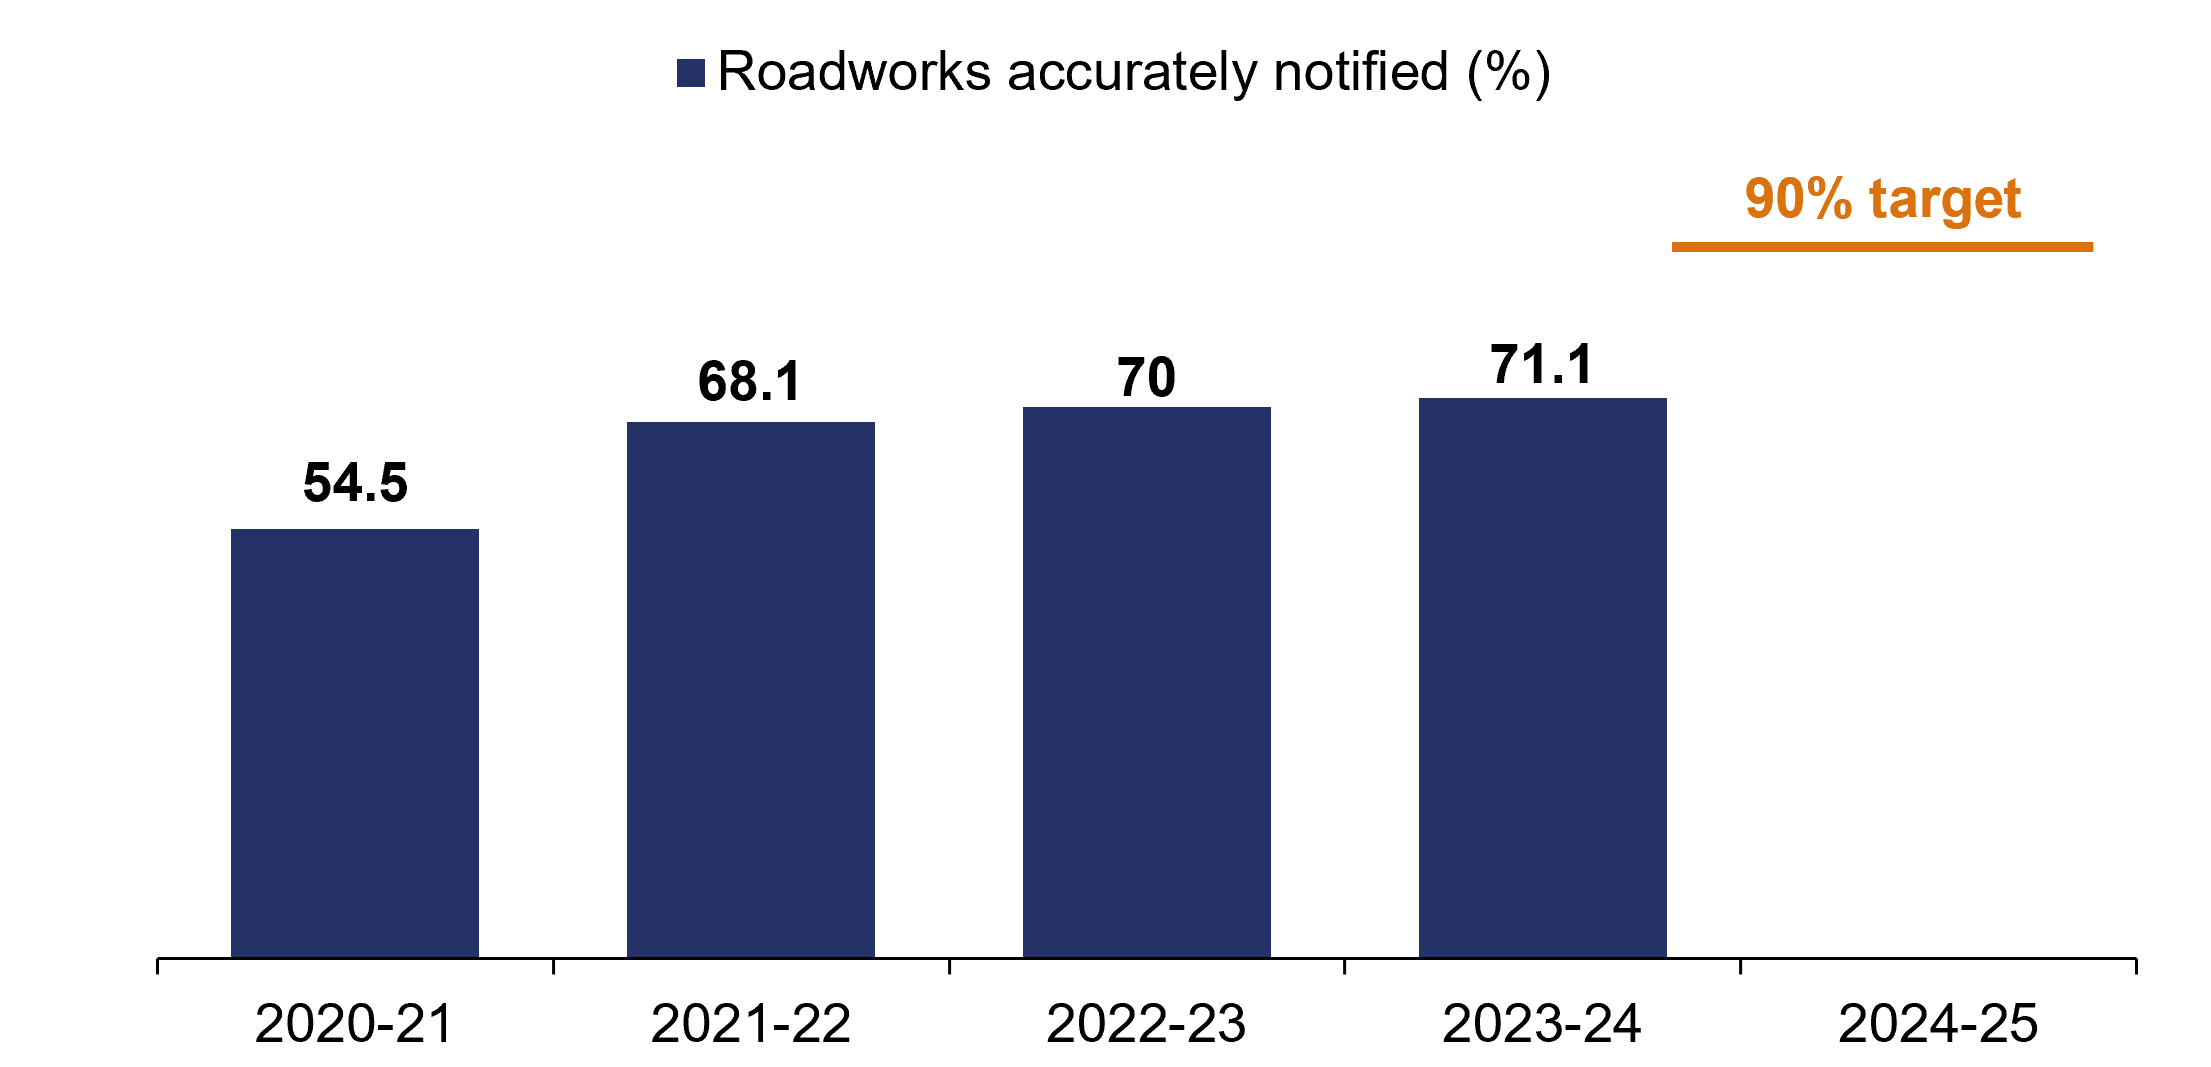
KPI: Roadworks information timeliness and accuracy
Road users, especially freight and logistics firms, rely on timely and accurate notice of road closures, especially overnight closures that require road users to use diversion routes.
National Highways has a KPI target that 90% of overnight road closures are accurately notified seven days in advance by the end of RP2. In Year 4, 71.1% of road closures were accurately notified seven days in advance, which is a significant improvement compared to the first year of the road period, when its accuracy rate was 54.5%, as shown in Figure 2.7. The rate of improvement has slowed, with an increase of 1.1 percentage points in Year 4, compared to a 1.9 percentage point improvement in the previous year and it is off-track to achieve its end of road period target.
Data from the company shows that three of its six regions achieved accuracy rates of 75% in the reporting year. It is important that the company shares best practice from these regions so that users have a consistent level of service across the network.
Figure 2.7 Roadworks information timeliness and accuracy KPI, annual data, April 2020 to March 2024
At our request, National Highways produced an action plan to improve performance in Year 4, which it has delivered. Additional actions are needed to further improve performance in the final year of RP2. Therefore, we require the company to set out a further action plan for Year 5 that we will hold it to account for delivering.
In the reporting year, we raised concerns with National Highways about the company’s ability to deliver the target and required it to provide us with detailed analysis of the reasons why some closures are not accurately notified seven days in advance.
The 90% target was set at the start of the road period, when there was limited available data on prior performance. National Highways’ analysis evidenced that this target was unachievable, with 14% of closures in Year 4 due to unplanned safety repairs or other reasons outside of the company’s control, such as weather. The company has therefore proposed a lower target for the end of RP2, subject to government decision. The proposed change requested by National Highways appears reasonable and would continue to be challenging and deliverable.