The public sector budgeting framework
The budgeting system is designed to support the UK’s public spending framework. Estimates are the mechanism by which Parliament authorises departmental spending and are presented using the public sector budgeting framework. Through the Estimates process, Parliament is required to vote limits for different budgetary categories of spending. For ORR, these are the:
- Net Resource Departmental Expenditure Limit (RDEL) requirement.
- Net Capital Departmental Expenditure Limit (CDEL) requirement.
- Net Cash Requirement (NCR) for the Estimate as a whole.
A breach of any of these voted limits would result in an Excess Vote. Parliament must be asked to vote an actual amount for any control limit. Therefore, in ORR’s case, as our income fully covers our costs, the Estimate shows a token £4,000 to be voted.
A summary of our income and expenditure capital outturn compared to the 2022-23 Estimate and 2021-22 outturn is shown in the table below.
Table 8: Outturn against 2022-23 financial control totals and 2021-22 outturn
| Outturn Category | 2022-23 outturn (£000) | 2022-23 estimate (£000) | 2021-22 outturn (£000) |
|---|---|---|---|
| Economic regulation income | (19,192) | (19,866) | (15,865) |
| Health and safety regulation income | (17,738) | (18,449) | (17,376) |
| Highways monitoring income | (3,018) | (3,441) | (2,651) |
| Total income | (39,948) | (41,756) | (35,892) |
| Staff costs expenditure | 28,672 | 30,095 | 25,508 |
| Other costs expenditure | 11,219 | 11,665 | 10,387 |
| Finance costs | 60 | - | - |
| Total expenditure | 39,951 | 41,760 | 35,895 |
| Net operating cost/net resource outturn (RDEL) | 3 | 4 | 3 |
| Net capital outturn (CDEL) | 450 | 720 | 619 |
| Net cash requirement (NCR) | 2,060 | 5,000 | (530) |
This table ties directly to the Statement of Outturn against Parliamentary Supply, a key accountability statement which is audited.
Variances between Estimate and outturn
Income
All rail-related costs are recovered via licence fees or the safety levy which are invoiced based on estimated costs. Therefore, any over-recovery is treated as deferred income and any under-recovery as accrued income, as set out in note 5 to the accounts. All highways-related costs are recovered in full from the Department for Transport.
Income from economic regulation comprises income from the licence fee, HS1 and our monitoring of Northern Ireland. Health and safety regulation income includes income from railway service providers and from the Channel Tunnel.
Expenditure
In 2022-23 we spent a total of £40.0m compared to £35.9m in 2021-22. Our overall gross budget for 2022-23 was £41.8m.
By segment, our spend breaks down as follows:
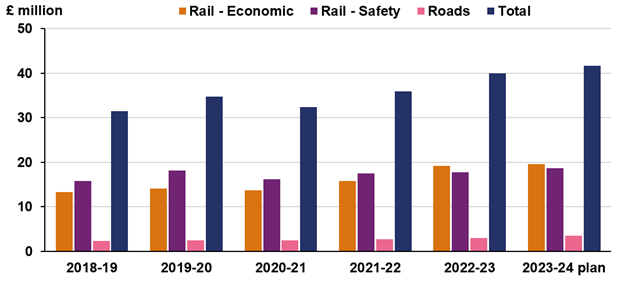
- £3.3m more on economic regulation than last year, at £19.2m (£0.7m less than budget).
- £0.4m more on safety regulation than last year, at £17.7m (£0.8m less than budget).
- £0.4m more on our highways monitoring role compared to last year, at £3.0m (£0.4m less than budget).
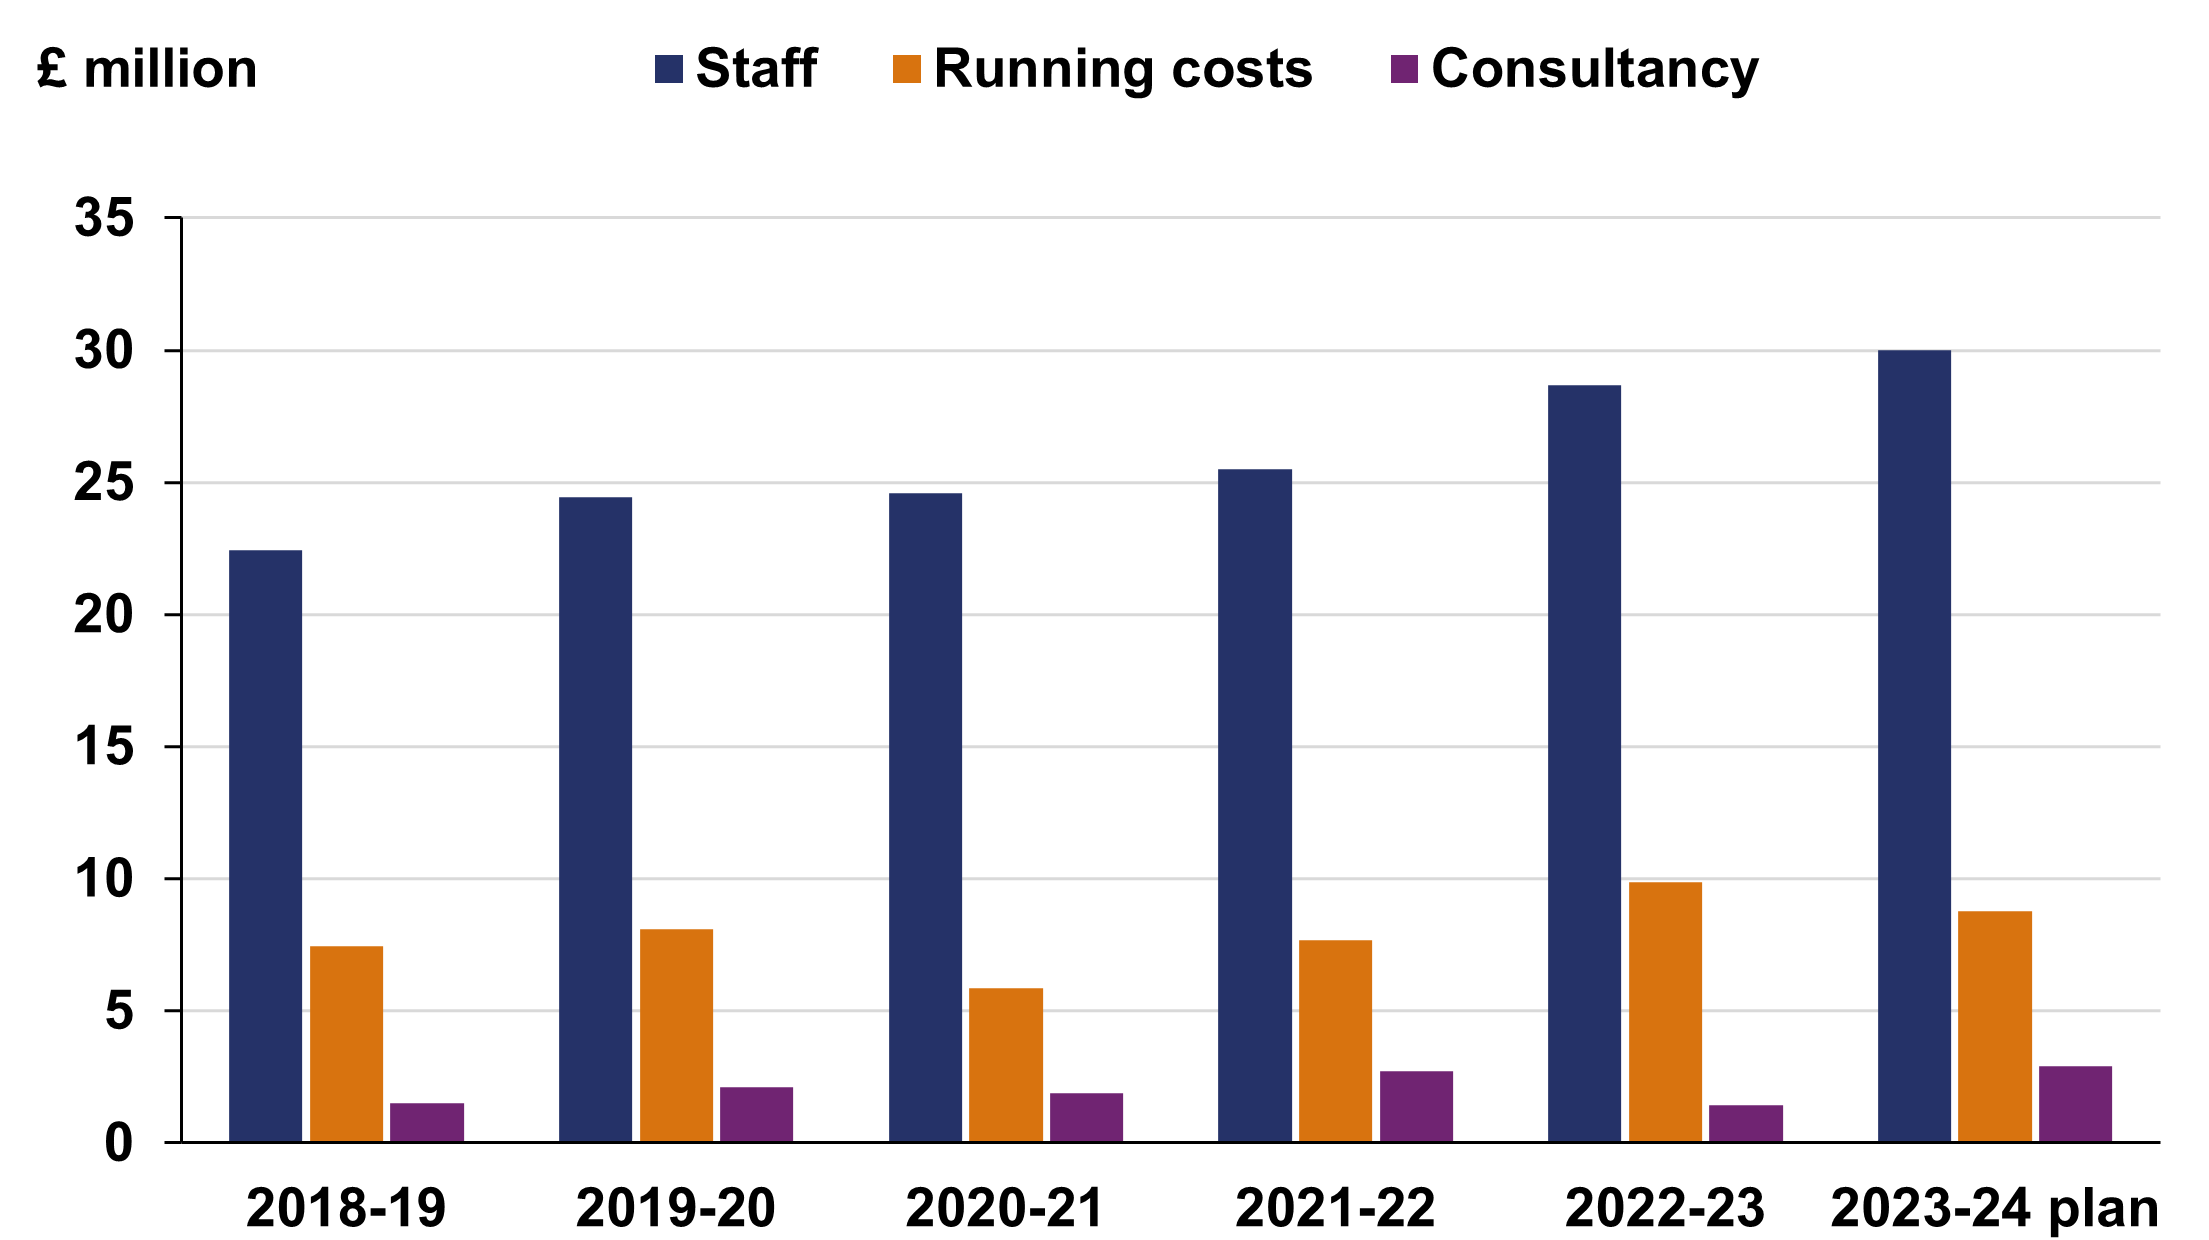
Our largest area of underspend was staff costs where we spent £1.4m (5%) less than budget. This is due to a number of staff vacancies not being filled throughout the year as well as a number of roles which were difficult to recruit into being covered by consultants.
Staff costs accounted for £28.7m (72%) of total costs, compared to £25.5m (71%) in 2021-22. Our average staff cost per full-time equivalent (including employer’s National Insurance and pension contributions) in 2022-23 was £77,495 compared to £74,804 in 2021-22.
Our travel and subsistence costs have increased to close to pre-pandemic levels and we spent £0.4m (70%) more than last year. We spent £0.3m (14%) more than last year on IT costs in the second year of our IS strategy. We had fewer senior appointments in 2022-23 resulting in lower recruitment costs than last year. We spent more than last year on cybersecurity and utilities.
Long-term expenditure trends
The chart below shows our spending pattern, in cash terms, over the last five years and for the 2023-24 plan, split by key work area.
Chart 1: Spend by key work area over the last five years and 2023-24 plan

The following chart shows how our spending breaks down by category of spend over the last five years and for the 2023-24 plan.
Chart 2: Spend by category over the last five years and 2023-24 plan

Capital expenditure
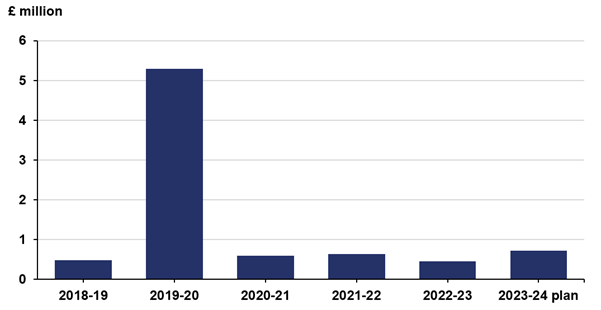
Net capital expenditure was £0.5m compared to £0.7m budget. The chart below shows CDEL outturn for the last five years and for the 2023-24 plan. Capital expenditure in 2019-20 was higher than usual at £5.2m, due to fit-out costs associated with the London office move.
Chart 3: CDEL outturn over the last five years and 2023-24 plan

Net cash requirement
We had a net cash requirement (NCR) of £2.1m compared to £5.0m requested in the Estimate. We request an NCR to cover timing differences, and £2.1m was required to cover receipts which did not come in until after the year end.
Future plans
We agreed a multi-year budget with HM Treasury through the 2021 Spending Review (SR21). Our overall operating expenditure budget will remain the same in 2023-24 and 2024-25 as in 2022-23, at £41.7 million. We have also secured £0.7 million of capital budget, which we will use largely for renewal of operational assets.
Allocating resources to where they will be most efficiently used in order to meet our strategic objectives will be essential in the current economic environment. Our priorities in 2023-24 include: driving improvements to train service performance; focusing on the efficiency of Network Rail; working with the rail industry to ensure safe operations in the event of further industrial action; determining the 2023 Periodic Review which looks at Network Rail’s funding and delivery from 2024 to 2029; doing the same for the third Road Investment Strategy between 2025 and 2030; and supporting the government in its rail reform programme.

