HS1 Ltd’s income and expenditure for the year is summarised in Table 4.1. Please note that some figures in this chapter may not sum due to rounding.
Table 4.1 Summary of HS1 Ltd’s regulated income and expenditure 1 April 2023 to 31 March 2024, compared to PR19 forecast and previous reporting year
| £m, 2023 to 2024 prices | Actual | PR19 forecast | Difference better/(worse) | 2022 to 2023 |
|---|---|---|---|---|
| Income | - | - | - | - |
| Operations, Maintenance, and Renewals (OMR) charge | 79.8 | 70.4 | 9.4 | 61.6 |
| Pass-through income | 25.9 | 24.7 | 1.2 | 22.4 |
| Total income | 105.7 | 95.1 | 10.6 | 84.0 |
| Controlled track costs | - | - | - | - |
| Network Rail (High Speed) | 53.3 | 53.5 | 0.1 | 49.9 |
| HS1 | 12.6 | 11.7 | (0.9) | 13.0 |
| Network Rail Infrastructure Ltd | 1.8 | 2.0 | 0.2 | 1.7 |
| Other | 2 | 2.9 | 0.9 | 1.9 |
| Total controlled track costs | 69.8 | 70.1 | 0.3 | 66.6 |
| Pass through costs | - | - | - | - |
| Rates | 10.9 | 11.1 | 0.2 | 9.2 |
| UK Power Network fees and renewals | 7.1 | 7.4 | 0.3 | 6.8 |
| Insurance | 3.7 | 3.9 | 0.3 | 3.8 |
| Power-non traction | 4.4 | 2.3 | (2.0) | 2.7 |
| Total pass through costs | 25.9 | 24.7 | (1.2) | 22.5 |
| Freight costs | - | - | - | - |
| Network Rail (High Speed) | 0.1 | 0.1 | 0.0 | 0.1 |
| Network Rail Infrastructure Ltd | 0.2 | 0.2 | 0.0 | 0.2 |
| HS1 | 0.1 | 0.1 | 0.0 | 0.1 |
| Total freight costs | 0.4 | 0.4 | 0.0 | 0.4 |
| Total OMR costs | 96.1 | 95.2 | (0.9) | 89.4 |
| Performance related payments | 0.0 | 0.0 | 0.0 | 0.0 |
| Total costs | 96.1 | 95.2 | (0.9) | 84.6 |
| Net income / (expenditure) | 9.6 | (0.1) | 9.8 | (5.4) |
Source: HS1 Ltd AMAS, 1 April 2023 to 31 March 2024 and 1 April 2022 to 31 March 2023.
Income
HS1 Ltd received £105.7m of regulated income this reporting year, £10.6m higher than assumed in our PR19 forecast.
Regulated income relates to all the OMR charges that HS1 Ltd receives from train operators to run the network, and pass-through income which it receives from train operating companies to recover certain costs such as for the use of traction electricity.
Table 4.2 Summary of HS1 Ltd’s regulated income 1 April 2023 to 31 March 2024
| - | £m, Feb 2023 prices | Actual | PR19 | Difference better/(worse) |
|---|---|---|---|---|
| International | OMR charges | 29.4 | 24.8 | 4.6 |
| International | Pass-through charges | 6.8 | 7.2 | (0.4) |
| International | Total | 36.2 | 32.0 | 4.2 |
| Domestic | OMR charges | 50.0 | 45.4 | 4.6 |
| Domestic | Pass-through charges | 19.2 | 17.5 | 1.7 |
| Domestic | Total | 69.2 | 62.9 | 6.3 |
| Freight | OMR charges | 0.4 | 0.2 | 0.2 |
| Freight | Pass-through charges | 0.0 | 0.0 | 0.0 |
| Freight | Total | 0.4 | 0.2 | 0.2 |
| Total regulated income | 105.7 | 95.1 | 10.6 |
Source: HS1 Ltd AMAS, 1 April 2023 to 31 March 2024.
Income from OMR charges
£79.8m of HS1 Ltd’s regulated income was from charges to train operators for operating, maintaining and renewing its network. There are agreed chargeable journey times for each service group at a rate per minute or per km per train.
These charges, together with train numbers, drive the revenue. Overall, income from OMR charges was £9.4m above the CP3 forecast due to £4.6m higher recovery on Eurostar train service paths and £4.6m higher recovery on Southeastern’s train services following charging reopeners to reflect actual train volumes, plus £0.2m higher recovery costs for freight.
An element of route OMR charges is designed to build up a fund to pay for future renewals resulting from today’s wear and tear of the network. This is deposited in an escrow account which is then permitted to be invested, within parameters set out in the Concession Agreement. Both passenger train operators on the network were offered a temporary route escrow payment holiday from Period 1 2020/21 to Period 3 2021/22.
This offer was accepted by Eurostar who deferred around £15.7m of payments into the escrow account which it must repay with interest within CP3.
The immediate impact of the pandemic on HS1 Ltd’s regulated income was somewhat reduced by the protections embedded within the concession structure. However, income in the first three years of CP3 was overall much lower than budget; the reduced number of services in the First Working Timetable from both Eurostar and Southeastern resulted in unrecovered fixed costs on trains not run.
HS1 Ltd also identified a shortfall during the third annual reopener (£3.0m in February 2018 prices) due to the percentage split of domestic services in its charging model did not align with the split of services set out in the Domestic Underpinning Agreement that it holds with the UK Government.
The volume reopener model was built to ensure full recovery of fixed costs over the course of the entire control period, including allowing HS1 Ltd to recover the shortfall, and this meant that OMR charges income from passenger train operators in the reporting period was above control period budget levels.
Expenditure
Controlled track costs
The majority of HS1 Ltd’s regulated route costs (£53.3m of a total of £96.1m) were incurred in operating and maintaining its network. This work is undertaken through a long-term, fixed price contract with NR(HS). Table 4.3 provides a breakdown of NR(HS)’s costs.
The Operator Agreement between HS1 Ltd and NR(HS) requires the former to pay train operators if NR(HS) outperforms our PR19 financial assumptions in years 3, 4 and 5 of a control period.
The formula requires NR(HS) to make significant savings before having to share the outperformance, so a material outperformance share with train operators requires substantial savings.
In this reporting year NR(HS) underperformed by £2.5m and therefore no payments are required to be shared with train operators.
Table 4.3 Network Rail (High Speed) costs 1 April 2023 to 31 March 2024, compared to PR19 forecast and previous reporting year
| £m, Feb 2023 prices | Actual | PR19 | Difference better/(worse) | 2022 to 2023 |
|---|---|---|---|---|
| Staff costs | 24.2 | 24.8 | 0.6 | 22.4 |
| Plant & materials | 6.1 | 6.9 | 0.8 | 6.4 |
| Overheads | 6.0 | 4.2 | (1.8) | 3.9 |
| Corporate functions & Network Rail Infrastructure Ltd | 3.8 | 4.7 | 0.9 | 3.7 |
| Sub-contractors | 3.3 | 3.0 | (0.3) | 2.4 |
| Consultancy costs | 1.5 | 0.7 | (0.8) | 1.9 |
| Security of infrastructure | 1.8 | 2.4 | 0.6 | 1.7 |
| Insurance | 0.6 | 0.8 | 0.2 | 0.6 |
| Operating costs | 47.2 | 47.6 | 0.4 | 43.0 |
| Management fee | 3.8 | 3.8 | 0.0 | 3.6 |
| Risk premium | 4.9 | 2.1 | (2.9) | 1.7 |
| Over/under Performance | (2.5) | 0.0 | 2.5 | 0.0 |
| Total NR(HS) costs | 53.5 | 53.5 | 0.0 | 48.3 |
Source: NR(HS) Outturn statements, 1 April 2023 to 31 March 2024 and 1 April 2022 to 31 March 2023.
HS1 Ltd’s internal costs are shown in Table 4.4. This was £12.6m for the reporting year, £0.9m higher than forecast at PR19. HS1 Ltd has incurred £0.9m of costs associated with an organisational restructure.
This has increased staff and technical support costs in the short term but is expected to result in around £1.1m per year of savings in future years.
Table 4.4 HS1’s internal costs 1 April 2023 to 31 March 2024, compared to PR19 forecast and previous reporting year
| £m, 2023 to 2024 prices | Actual | PR19 forecast | Difference better/(worse) | 2022 to 2023 |
|---|---|---|---|---|
| Staff costs | 6.7 | 6.0 | (0.7) | 6.6 |
| Technical support / consultants | 2.2 | 1.5 | (0.7) | 2.7 |
| Office running costs | 1.6 | 1.6 | 0.1 | 1.5 |
| R&D | 0.3 | 0.5 | 0.2 | 0.1 |
| Other costs | 1.9 | 2.1 | 0.2 | 2.0 |
| Total HS1 costs | 12.6 | 11.7 | (0.9) | 13.0 |
Source: HS1 AMAS, 1 April 2023 to 31 March 2024 and 1 April 2022 to 31 March 2023.
Pass-through costs
Some of HS1 Ltd’s costs are passed straight through to train operators by offsetting pass-through income. These costs are largely uncontrollable by HS1 and include traction electricity costs, business rates and insurance.
Pass-through costs were £25.9m this reporting year, which represented underperformance of £1.2m against PR19 assumptions. Most of the overspend derived from a £2.0m overspend on non-traction power due to increased electricity costs.
Freight costs
HS1 Ltd incurs costs relating to freight traffic, including maintaining freight-specific infrastructure, which it passes through to operators through OMR charges.
Freight costs were £0.4m, which was in line with the PR19 forecast.
Efficiency
As part of PR19, we determined an efficient level of cost for the operations, maintenance and renewal of the route infrastructure.
The largest element of HS1 Ltd’s costs is its contract with NR(HS). At PR19, we accepted NR(HS)’s plan to increase efficiency by £8.6m (6.7%) across the five years of CP3.
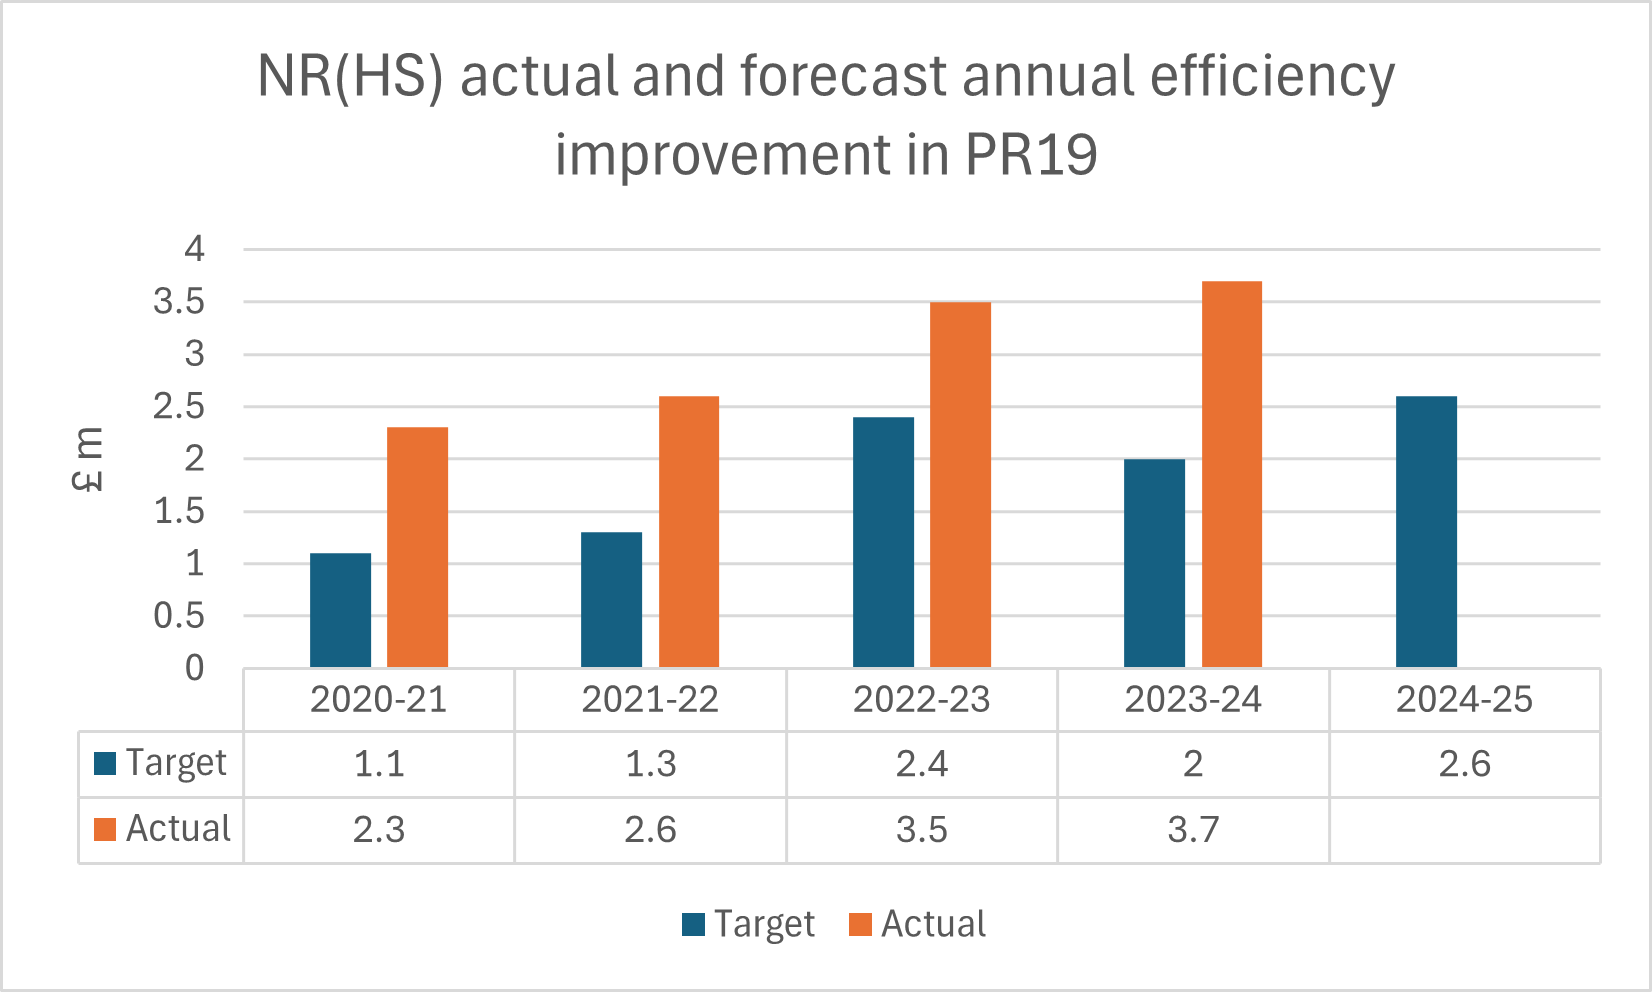
This means that to deliver the same level of output, we expected NR(HS)’s costs in the final year of CP3 to be 6.7% lower than in the final year of CP2. For this reporting year, the expected efficiency was £2.9m.
NR(HS) has reported efficiencies additional to those planned: £3.7m against the target of £2.0m. This included £2.4m of staff-related savings due to managing vacancy gaps and workforce reform benefits, and £1.2m after negotiating a reduction in national functions paid for through a provision of services agreement with Network Rail Infrastructure Ltd for the remainder of the control period.
NR(HS) therefore expects to meet the efficiency challenge that we set at PR19. To demonstrate its progress, NR(HS) reports to us using a “fishbone” analysis which includes efficiencies, headwinds (unplanned cost increases due to external factors such as the pandemic, tailwinds (unplanned cost decreases due to external factors), scope changes (planned changes to levels of work undertaken) and input prices (inflationary effects from increases or decreases in costs above general CPI inflation).
NR(HS) does not share this detailed annual breakdown with HS1 Ltd due to commercial sensitivities, but we expect the company to outline the magnitude of these savings to stakeholders in support of its CP4 plans.
Figure 4.1 NR(HS) actual and forecast annual efficiency improvement in PR19
Source: NR(HS) 1 April 2023 to 31 March 2024 O&M Efficiency Report.
Stations operations and maintenance costs
We do not regulate HS1 Ltd’s operations and maintenance spend for stations, which is agreed annually between the infrastructure manager and station operators.
We understand that HS1 Ltd spent around £37.4m on these costs in the reporting year, against a budget of £39.9m.
Route escrow account
Some of HS1 Ltd’s access charges are paid into an escrow account to fund current and future renewals of the route.
This fulfils a similar function to the Regulatory Asset Base in other regulated utilities by spreading these costs over the long term to ensure that users of the railway pay their fair share.
The balance on the route escrow account (excluding investments) at 31 March 2024 was £74.0m. The escrow balance increased by £46.9m in the year due to:
- £43.1m of payments into the escrow account. This is an increase of £14.2m against the PR19 forecast. Some of this over-recovery relates to the ‘payment holiday’ following the pandemic, which is to be repaid within CP3. These funds are part of the OMR charges paid by operators and are designed to finance future renewals of the HS1 route. The collected amounts are deposited into the escrow account each quarter (similarly the stations long term charges (LTCs) are deposited into ring-fenced escrow accounts for each station each quarter)
- £13.0m was withdrawn to pay for renewals delivery, £4.4m less than forecast at PR19 due to less renewal work being undertaken than planned (see asset management section for more details)
- £2.7m of interest earned in the year
Funds invested as at year end for the route were £86m, maturing within the next 12 months.
Stations escrow accounts
Operator charges are paid into an escrow account to fund current and future renewals for each of the four stations: London St. Pancras International, Stratford International, Ebbsfleet international and Ashford International.
The balance across all the stations escrow accounts (excluding investments) at 31 March 2024 was £33.7m, £25.0m higher than at 31 March 2023.
The escrow balances comprise:
- £15.0m income into the escrow accounts through long term charges for each station
- £2.7m withdrawn to pay for renewals delivery
- £0.9m of interest earned in the year
Funds invested as at year end for the stations are £41.0m. The stations escrow funds have been invested on the same basis as route.
We understand that HS1 Ltd has been seeking to maximise interest earned on the escrow accounts, over retaining cashflow availability for renewals, since December 2021.
In the reporting year HS1 Ltd worked with DfT to identify opportunities to help narrow the gap between interest earned and inflation through changes to the Concession Agreement requirements on authorised investments.
We understand from operators’ responses to HS1 Ltd’s draft plans that operators support this work progressing as soon as possible but DfT and HS1 Ltd consider that amendments are unlikely to be made in time for the benefits to be taken into account in our PR24 determinations.
Overview of HS1’s statutory financial statements
HS1 made a profit after tax of £101.6m this reporting year (up from £36.8m the previous year) with earnings before interest, tax, depreciation and amortisation of £101.0m (£65.8m the previous year).
Its net assets increased to £289.1m from the £157.1m of the previous year, primarily due to reported profit.
The ratio of cash available to service the annual debt interest and principal payments (DSCR) for 1 April 2023 – 31 March 2024 was 1.51x (noting that this was 1.46x in the previous reporting year).
HS1 remained above its debt-service cover ratio (DSCR) covenant lock-up level of 1.20.
The lock-up level is a restriction of distributions. Until DSCR recovers to above the lock-up threshold, any cash generated in the period that was planned to be paid out to shareholders, must instead be set aside for debt service.
We note that no dividend payments were paid in the reporting year.