Executive summary
1. The Office of Rail and Road (ORR) holds Network Rail to account for its management of the rail network in Great Britain. We monitor how it operates the network to keep trains running on time and how it keeps the network safe and in good condition.
2. This report is our Annual Assessment of Network Rail. It sets out our views on Network Rail’s performance between 1 April 2023 and 31 March 2024, the fifth and final year of control period 6 (CP6) which began on 1 April 2019 and ended on 31 March 2024. It is referred to as ‘Year 5’ throughout this document.
3. This assessment reviews Network Rail’s network-wide performance. We separately report in detail on health and safety performance in our ‘Annual report of health and safety on Britain’s railways’. Network Rail must deliver high quality stakeholder engagement to support all its activities. We will publish our full assessment of Network Rail’s stakeholder engagement this autumn.
4. This report includes separate annexes which review the performance of Network Rail’s regions and its System Operator function, including how it performed for freight and national passenger operators. We also include an annex on the performance of the Wales and Borders route, presented in both English and Welsh.
5. Our key findings are set out below:
Following a period of declining train service performance, Network Rail implemented regional improvement plans and performance largely stabilised barring the effects of a severe autumn and winter period. However, performance in Wales & Western continued to deteriorate to unacceptable levels and following an investigation we found Network Rail in breach of its network licence.
6. Train reliability and punctuality largely stabilised during the year, but at levels that offer significant scope to improve services to passengers. During the year, the percentage of trains that arrived on time fell from 67.8% to 67.6%. Train cancellations remained level at 3.8%.
7. Total Network Rail-attributed delay minutes per 100 km of train travel increased during the year from 1.97 to 2.06 nationally, but trends varied across the regions. The largest national factor for increasing delay was the network’s ability to cope with a severe autumn and winter period. Despite its delivery of an improvement plan, performance continued to decline in the Wales & Western region and we initiated a formal investigation in November 2023. Since the year end, the investigation has concluded and we have found that Network Rail is in breach of its network licence as it is failing to achieve to the greatest extent reasonably practicable its obligations to secure the operation and maintenance of the network in the Wales & Western region in accordance with best practice. We have issued an order, requiring Network Rail to produce, by 31 August 2024, a robust and evidenced plan identifying the further activities it will undertake to improve performance in the Wales & Western region.
8. Network Rail’s other regions responded to lower performance levels by setting out detailed performance improvement plans. We held the regions to account for delivering the actions in these plans and Network Rail has provided evidence that individual schemes are delivering improvement.
9. Delay in these regions stabilised with signs of improvement in the first half of the year. This improving trend continued in the Southern Region. However, North West & Central and Eastern regions eventually saw a worsening of delay following a windy and exceptionally wet autumn and winter. Network Rail Scotland’s delay level showed initial improvement but declined slightly over the full year. As well as weather-related delays, the regions (other than Southern) also saw more delay attributed to non-track assets, such as points and axle counters. Other issues which are outside Network Rail’s control affected train performance during the year, such as industrial action by train operators’ staff.
10. Network Rail must ensure the regional plans are reviewed regularly and remain focused on the right interventions. We will continue to scrutinise the governance of the plans and delivery of the actions in them and will intervene where we are not satisfied with the progress made. Performance must remain a priority for Network Rail in control period 7 (CP7) between 1 April 2024 and 31 March 2029, for both passengers and freight.
11. Network Rail has continued to demonstrate its commitment to leading whole industry performance management capability. Following ORR’s 2023 review of the Joint Performance Strategies, in which we found them to be generally well-prepared, Network Rail has used the Performance Improvement Management System (PIMS) Governance Board to lead a peer review of their practical implementation. This was completed in late 2023, highlighting to routes and operators the strengths and opportunities to improve maturity levels across twelve separate categories. The process will be repeated in 2024 and is expected to focus substantially on implementation of lessons identified.
12. However, we have concerns about Network Rail’s ability to consistently roll out examples of operational good practice across its devolved regions. This drives inefficiency and can slow progress, as each region develops its own solution to common/similar problems. This must be a renewed area of focus given the financial constraints and difficult choices to be faced in CP7.
Freight performance improved steadily over Year 5 following a particularly poor start. However, delays related to asset reliability continued and Network Rail must make improvements in this area. Network Rail must also be clearer about the roles the regions and the System Operator play in improving freight train performance.
13. Freight train performance improved steadily over the year following a period of widespread cancellations and late-running services. The moving annual average (MAA) percentage of commercial freight services arriving at their planned destination within 15 minutes of booked arrival time steadily improved from its lowest level (85.1% in May 2023) to 90.3% at the end of the year.
14. Freight cancellations ended the year at 1.78%. This was slightly worse than the Network Rail scorecard target of 1.68%. The main causes of freight cancellations were asset failures across the network, other significant incidents (for example the closure of Nuneham Viaduct) and severe weather.
15. Network Rail’s regional performance improvement plans have delivered benefits during the year, and we have seen evidence of the System Operator collaborating with the regions and industry to achieve improved performance (e.g. through the Mendip Rail timetable change in Wales & Western region). However, we have yet to see consistent evidence of leadership by the System Operator and regional freight performance remains mixed. In December 2023, we wrote to Network Rail to explain that we required accountabilities and responsibilities for freight within Network Rail to be much clearer as we start CP7, particularly the respective roles of the regions and the System Operator. That clarity is essential for assurance that the required performance improvement activities are being delivered. Network Rail has made progress to address our concern through the System Operator’s work to develop national strategies for freight performance and growth for CP7. We have also worked closely with the regions to better understand their action plans and to agree how we will monitor them. We will maintain a close watch on progress and intervene if required.
16. We closely monitored the freight team in the System Operator as it developed its freight growth plans for CP7. We saw evidence of the team engaging with and providing leadership to the regions in developing growth plans. For example, it developed a National Freight Performance Strategy for CP7 to act as a framework for the regions’ plans. The strategy includes initiatives to be delivered in collaboration with freight train operating companies (e.g. best practice agreements for third party connections to the network). We have seen this approach featuring as part of the regions’ plans and we continue to engage with the System Operator and regions as they develop the actions needed to deliver on them in CP7.
Network Rail delivered its efficiency plans for the year and achieved its target of £4.0 billion of savings for CP6 overall. Wider financial performance declined in the year, in part due to performance-related compensation payments to train operators. Network Rail must now focus on delivering efficiencies in Year 1 of CP7 and over the course of the control period.
17. Network Rail reported £1,116 million of efficiencies in Year 5, an 18% increase on the previous year. Despite the challenges it has faced over CP6, notably the pandemic, extreme weather conditions, industrial action and inflationary pressures, Network Rail successfully delivered its cumulative revised efficiencies target of £4.0 billion of savings over the control period. This has been achieved through several initiatives including making better use of in-house skills, improving the efficiency of engineering works and changes in the standards governing different aspects of maintenance and renewals activity.
18. However, the regional picture varies. In Year 5, all regions exceeded their original CP6 targets. Southern and Scotland also exceeded their more stretching in-year delivery plan targets, by 4% and 1% respectively. The other regions were slightly short of these stretch targets, largely as a result of delays in workforce modernisation initiatives. Southern outperformed its revised target by 4% following improved contracting strategies and the implementation of new technologies and Scotland outperformed it by 1% as a result of additional pay-related savings and other initiatives performing better than anticipated. Network Rail’s National Functions saw efficiency savings of £258 million over the year, exceeding its revised target by 21%.
19. Network Rail Scotland delivered £73 million of efficiency saving in Year 5, exceeding its in-year delivery plan (£72 million) by 1% and our original CP6 target (£67 million) by 9%. It delivered £351 million of efficiency savings over the control period, 1% above its revised CP6 delivery plan (£349 million) and 12% above its original CP6 target (£314 million). Key efficiency savings over CP6 were made in contracting strategies, supply chain management, optimisation of access and workplace reform.
20. Year 5 was the final year of CP6 and Network Rail’s leading indicators now focus on its readiness to deliver for Year 1 of CP7 and the remainder of the new control period. Current indications are that 72% of Network Rail’s regional efficiency targets have completed or well-developed plans for Year 1 of CP7, while 28% have only minimal plans in place. Network Rail is working to ensure the plans are robust and achievable. To support Network Rail, we have commissioned an independent reporter to review the robustness of the plans and provide recommendations in less-developed areas.
21. Network Rail reported £479 million of financial underperformance compared to its annual budget in Year 5. This was primarily due to poor train performance resulting in Network Rail making payments to train operators (through the Schedule 8 incentive scheme). Other contributing factors included inflationary pressures and underperformance in renewals, with regions having to reprioritise their workbanks to remain within their overall available funding. This was largely driven by access constraints compared to plan, contractor delivery problems, plant failures and challenging weather conditions.
22. Going into Year 5, Network Rail had no risk funding available to manage unforeseen risks, having used up its CP6 risk funding in the first four years of the control period to manage risks associated with the pandemic, industrial action, severe weather conditions and inflationary pressures. In Year 5, it therefore managed its risk by reprioritising its workbanks and reducing the scope of renewals to manage changes in costs.
Network Rail largely delivered its asset condition target and planned effective renewals volumes. Shortfalls in renewals of structures and track have increased pressures on maintaining and renewing core assets in CP7. Network Rail must continue to improve its asset knowledge, delivering its agreed recovery plan for structures examinations and continuing to improve its management of drainage assets to better address challenges of extreme weather.
23. Network Rail delivered 99.1% of its planned effective renewals volume across its network, just short of its target for Year 5. The delivery of renewals at regional level was varied. Three of its regions significantly exceeded their effective renewals targets but two regions fell short. While Network Rail over-delivered on certain asset groups, effectively offsetting shortfalls in others, renewals of critical assets such as track and structures were under-delivered. This imbalance has led to increased pressure on maintenance and core renewal activities, which will carry over into CP7.
24. The Composite Sustainability Index (CSI) metric is a high-level indicator of the overall condition of assets. It shows the percentage improvement of asset sustainability in comparison to the end of Control Period 4 between 1 April 2009 and 31 March 2014 (CP4). Network Rail ended CP6 with a CSI of −1.2%, which was 0.4 percentage points (pp) above its target.
25. Asset reliability, as measured by the Composite Reliability Index (CRI), for Scotland, Wales & Western, Southern and North West & Central regions finished below target. Despite this Southern and North West & Central region’s saw an improvement in CRI over the last year. Eastern region’s CRI also improved in Year 5 and finished above its target. Reliability was notably poor in Wales & Western, which underperformed across nearly all key asset areas. Track and electrification asset failures were significant contributors to this and were a key focus of our investigation and its recommendations.
26. Network Rail remains behind on its structures examinations in all regions. This shortfall may lead to the potential for undetected faults which could have safety and/or performance impacts. In May 2023 we wrote to Network Rail setting out our continuing concerns and underlining the potential for regulatory action. In response, Network Rail’s regions submitted recovery plans aimed at returning to compliance. We undertook a detailed assurance review at the end of the year and found that none of the regions had fully achieved their planned of examinations in line with their recovery plans. North West & Central and Southern regions had the higher discrepancies against their forecasts. We are therefore extending our enhanced monitoring and will reassess at the end of 2024.
27. Following the tragic events at Carmont in August 2020 and the subsequent reports from Lord Robert Mair and Dame Julia Slingo, improvements to the management of drainage assets has been a key focus. We have consistently challenged Network Rail to improve its asset knowledge and drainage management plans. It has improved its knowledge of drainage assets but two regions, Eastern and Southern, did not manage to complete their drainage asset registers before the end of CP6 as had been agreed with ORR. Network Rail’s regions also need to ensure that they manage their resources to carry out drainage inspections and maintenance effectively. Southern subsequently completed its full asset register in May 2024 and Eastern did so in June 2024.
Network Rail missed its national environmental target. It performed well against its waste management and carbon emissions reduction targets but fell short of its targeted 18% reduction in non-traction energy usage. It must now make improvements to support delivery of its environmental targets in CP7.
28. We measured Network Rail’s environmental performance during CP6 using a composite measure called the Environmental Sustainability Index (ESI) which covers waste, carbon emissions and reduction in non-traction energy usage.
29. Network Rail missed its national target for ESI. For waste, it exceeded its target for reusing or recycling waste, achieving 93.5% against a target of 90.0% and narrowly missed its target for diverting waste from landfill (by 0.1pp). While performance was above target for reducing non-traction carbon emissions, it was below target for reducing non-traction energy use.
30. North West & Central was the only region to exceed its annual ESI target. Wales & Western, Eastern, Network Rail Scotland, and Southern failed to achieve their overall ESI targets, with Eastern showing the worst performance, not meeting targets for any of the component measures of ESI.
31. We require Network Rail’s regions and Route Services to provide evidence of how they will deliver improved environmental performance in CP7.
Network Rail’s System Operator managed timetable risk effectively. It must continue to improve its management of critical industry processes and delivery of major projects.
32. The System Operator successfully delivered two major timetable changes (though the May 2023 change was marked by very late capacity applications from two operators and a region) underpinned by continuing effective risk management by the Industry Timetable Assurance Project Management Office (PMO). Over the last year we have intervened several times in track access application cases where the process appeared to lack robustness and coordination. We commissioned an independent reporter review in Year 5 which made recommendations on how to improve the process and we are following these up.
33. We have worked closely with the PMO during the year to collate and present improved information concerning the status of train operators’ access rights ahead of timetable changes. The PMO is now reporting more accurately on risks associated with rights not being in place in time. We have also seen evidence of the System Operator strengthening how it holds train operators and its regions to account for adhering to timetable production rules. We welcome the ongoing focus on achieving Network Code timescales for timetable production by December 2024.
34. The East Coast Main Line (ECML) timetable change, an extensive and complex recast needed to realise investment in infrastructure, was deferred for the fourth time because the PMO identified significant performance and delivery risks which had not been closed out during the advance planning process.
35. The PMO was transparent to stakeholders over the risks to performance and the System Operator led good, collaborative work across industry to resolve conflicts. It is now critical that wider lessons are learned by the industry, for both the eventual implementation of change on the ECML and for the planning of future major changes.
36. The System Operator had planned to deliver a number of significant projects in Year 5 but delivery has not progressed as planned in some important areas including the Industry Timetable Technical Strategy (ITTS). For ITTS, in Year 5 of CP6 and into CP7, the System Operator has adopted a more targeted approach through a series of smaller IT projects supporting timetable production and capacity planning with shorter delivery times and benefits now clearly defined.
Comparison of regional performance
37. A summary of key measures comparing regional performance in Year 5 is shown in charts below (note that each chart uses different scales). Please refer to the individual region annexes for commentary on each region’s performance.
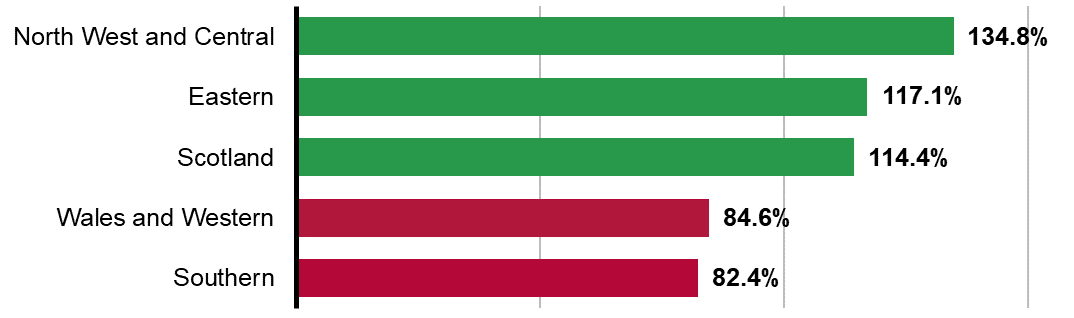
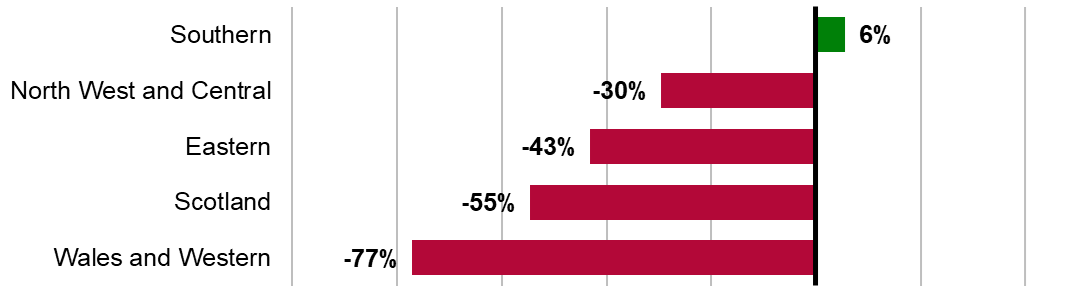
Figure 1. Overall scorecard performance by region, annual data, April 2023 to March 2024
Key:
- Green: Above target
- Red: Below target
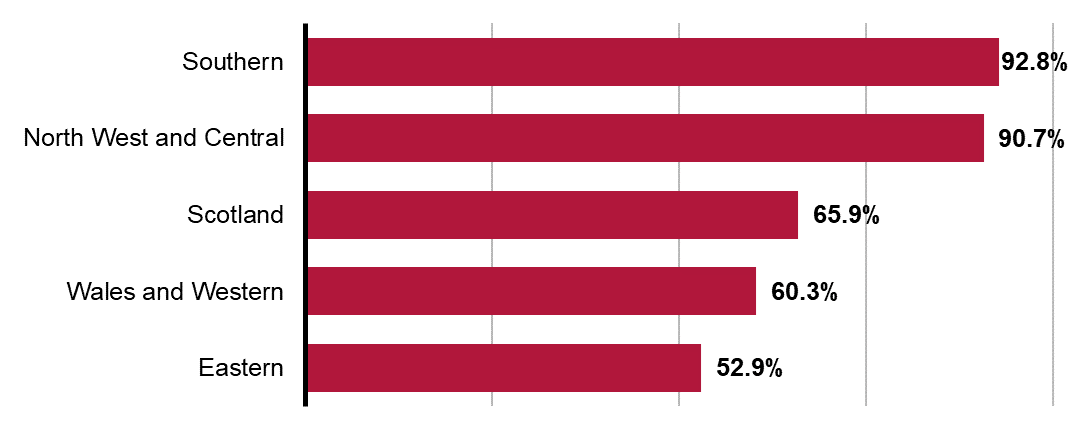
Source: Network Rail’s regional comparison scorecard
Figure 2. On Time by region, annual data, April 2023 to March 2024
Key:
- Green: Above target
- Red: Below target
Source: ORR analysis of Network Rail data
Figure 3. Efficiencies by region, variance of actual to revised delivery plan, annual data, April 2023 to March 2024
Key:
- Green: Above target
- Red: Below target
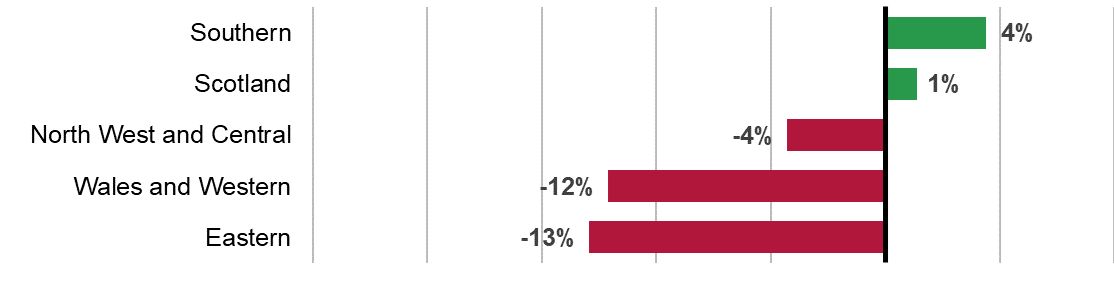
Source: ORR analysis of Network Rail data
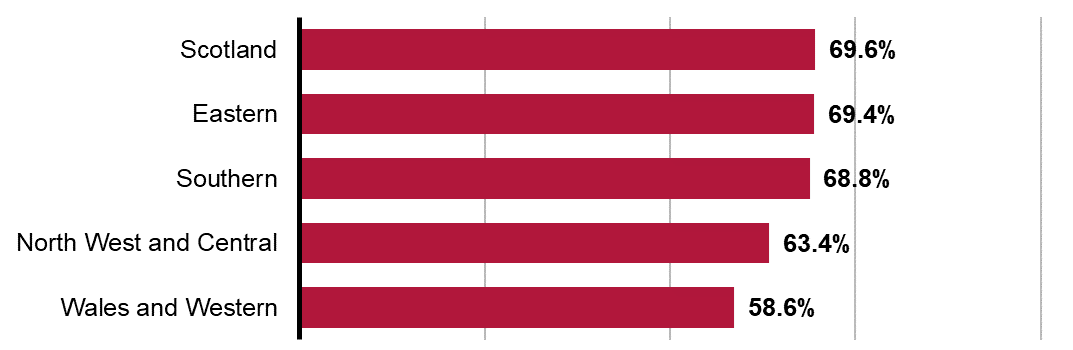
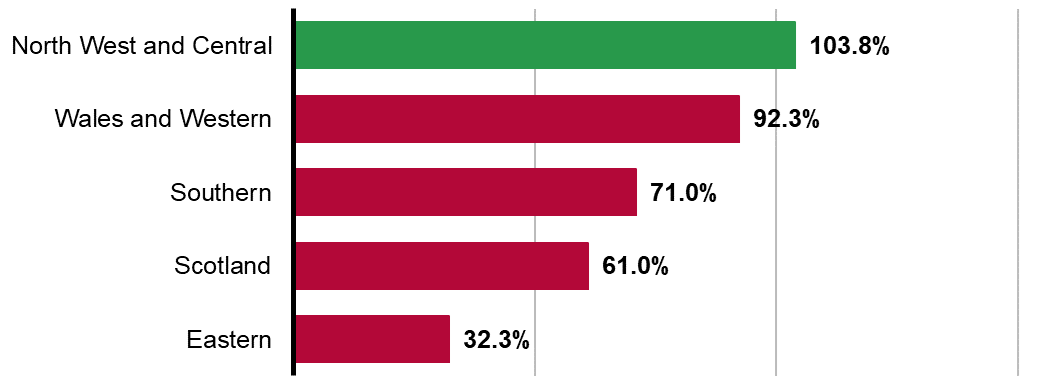
Figure 4. Effective volumes (renewals) percentage completion by region, annual data, April 2023 to March 2024
Key:
- Green: Above target
- Red: Below target
Source: ORR analysis of Network Rail data
Figure 5. Composite Reliability Index (CRI) by region, percentage variance to target, annual data, April 2023 to March 2024
Key:
- Green: Above target
- Red: Below target
Source: ORR analysis of Network Rail data
Figure 6. Environmental Sustainability Index (ESI) by region, annual data, April 2023 to March 2024
Key:
- Green: Above target
- Red: Below target
Source: ORR analysis of Network Rail data
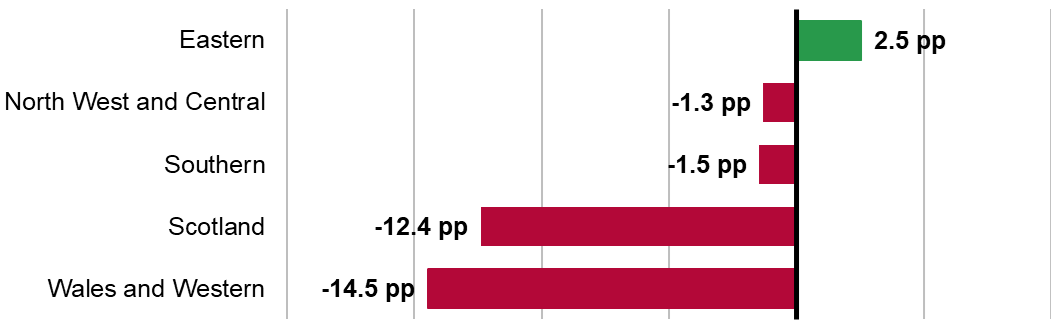
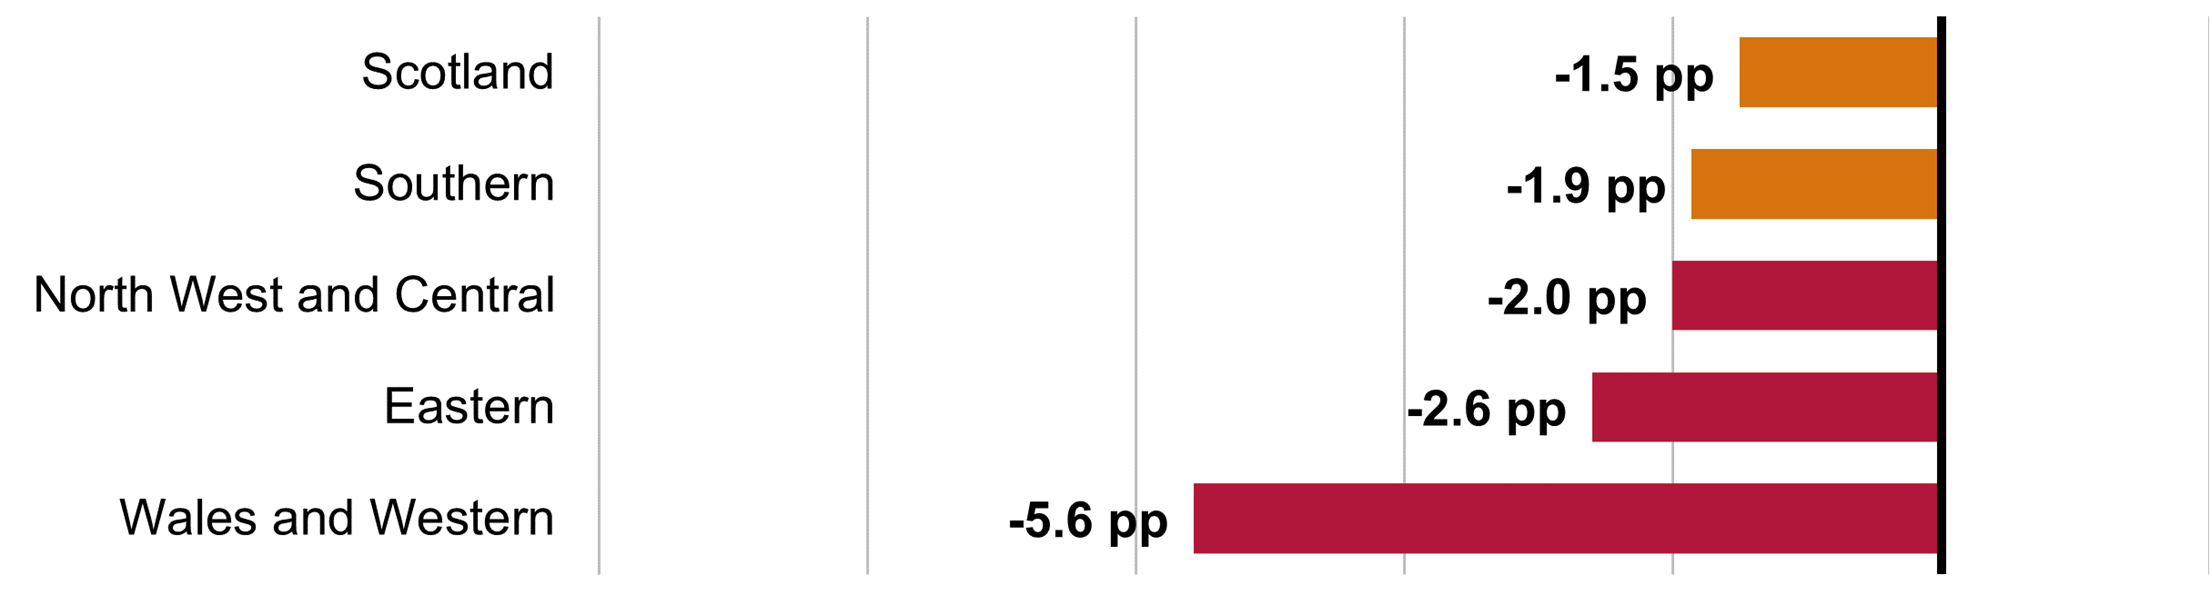
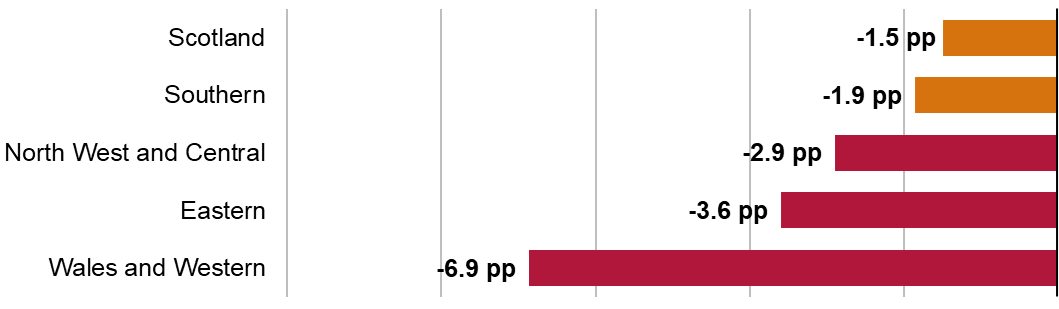
Figure 7. Passenger train performance (Network Rail attributed delay minutes normalised, CRM-P), percentage better/worse than target, annual data, April 2023 to March 2024
Key:
- Green: Above target
- Amber: Below target, but above regulatory floor
- Red: Below regulatory floor
Comparison to scorecard target
Source: ORR analysis of Network Rail data
Comparison to trajectory
Source: ORR analysis of Network Rail data
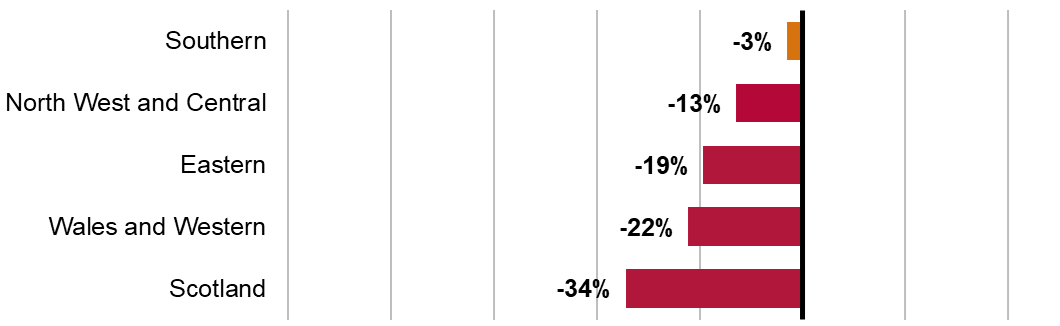
Figure 8. Freight performance by region (FDM-R), percentage better/worse than target, annual data, April 2023 to March 2024
Key:
- Green: Above target
- Amber: Below target, but above regulatory floor
- Red: Below regulatory floor
Comparison to scorecard target
Source: ORR analysis of Network Rail data
Comparison to trajectory
Source: ORR analysis of Network Rail data