The public sector budgeting framework
The budgeting system is designed to support the UK’s public spending framework. Estimates are the mechanism by which Parliament authorises departmental spending and are presented using the public sector budgeting framework. Through the Estimates process, Parliament is required to vote limits for different budgetary categories of spending. For ORR, these are the:
- Net resource departmental expenditure limit (RDEL) requirement.
- Net capital departmental expenditure limit (CDEL) requirement.
- Net cash requirement (NCR) for the Estimate as a whole.
A breach of any of these voted limits would result in an Excess Vote. Parliament must be asked to vote an actual amount for any control limit. Therefore, in ORR’s case, as our income fully covers our costs, the Estimate shows a token £2,000 to be voted.
A summary of our income and expenditure and capital outturn compared to the 2023-24 Estimate is shown in the table below.
| 2023-24 outturn (£000) | 2023-24 estimate (£000) | 2022-23 outturn (£000) | |
|---|---|---|---|
| Economic regulation income | (19,429) | (19,574) | (19,192) |
| Health and safety regulation income | (17,917) | (18,670) | (17,738) |
| Highways regulation income | (3,418) | (3,565) | (3,018) |
| Total income | (40,764) | (41,809) | (39,948) |
| Staff costs expenditure | 30,731 | 30,097 | 28,672 |
| Other costs expenditure | 9,971 | 11,649 | 11,219 |
| Finance costs | 64 | 65 | 60 |
| Total expenditure | 40,766 | 41,811 | 39,951 |
| Net operating cost/net resource outturn (RDEL) | 2 | 2 | 3 |
| Net capital outturn (CDEL) | 1,051 | 1,620 | 450 |
| Net cash requirement (NCR) | (1,973) | 4,000 | 2,060 |
This table ties directly to the statement of outturn against Parliamentary Supply in the Parliamentary accountability report, a key accountability statement which is audited.
Variances between Estimate and outturn
Income
All rail-related costs are recovered via licence fees or the safety levy which are invoiced based on estimated costs. Therefore, any over-recovery is treated as deferred income and any under-recovery as accrued income, as set out in note 5 to the accounts. All highways-related costs are recovered in full from the Department for Transport.
Income from economic regulation comprises income from the licence fee, HS1 and our monitoring of Northern Ireland. Health and safety regulation income includes income from railway service providers and from the Channel Tunnel.
Resource expenditure
In 2023-24 we spent a total of £40.8m compared to a budget of £41.8m and an outturn of £40.0m in 2022-23.
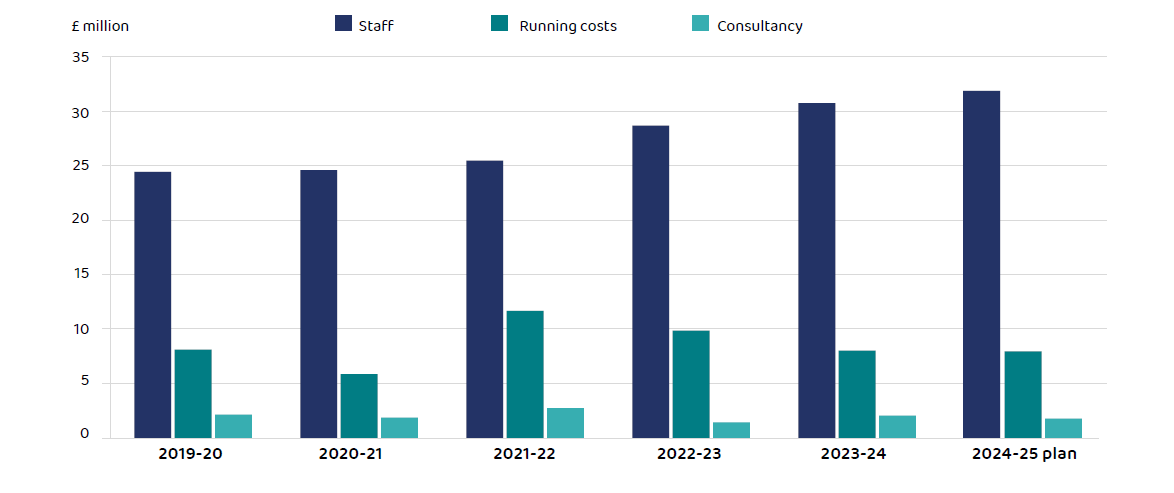
The majority of ORR’s costs are staff costs, which accounted for £30.7m (75%) of total costs, compared to £28.7m (72%) in 2022-23. We spent £0.6m (2%) more on staff costs than budgeted, as pay increases were higher than budgeted, and all staff were given a £1,500 cost of living allowance, following a Cabinet Office instruction. Our average staff cost per full-time equivalent (including employer’s National Insurance and pension contributions) in 2023-24 was £82,168 compared to £77,495 in 2022-23.
We spent £1.0m (33%) less on consultancy than expected and £0.6m (24%) less than last year. Some budgeted pieces of work related to our Channel Tunnel and National Highways work proceeded slower than expected due to factors outside of our control. We also spent less than expected on running costs associated with the set up of our sponsorship of the rail ombudsman.
Assets and liabilities
At 31 March 2024, ORR remains in a net liability position. Net liabilities have increased from £0.8m at 31 March 2023 to £2.7m at 31 March 2024. This has been mainly driven by: £0.7m lower non-current assets , caused by depreciation of property, plant and equipment being significantly higher than additions; and £2.3m lower trade and other receivables due to collecting safety levy debtors in more quickly in 2023-24; partly offset by a decrease in trade and other payables (excluding Consolidated Fund balances) of £0.8m caused mainly by lower trade payables; and £0.4m lower non-current lease liabilities.
Long-term expenditure trends
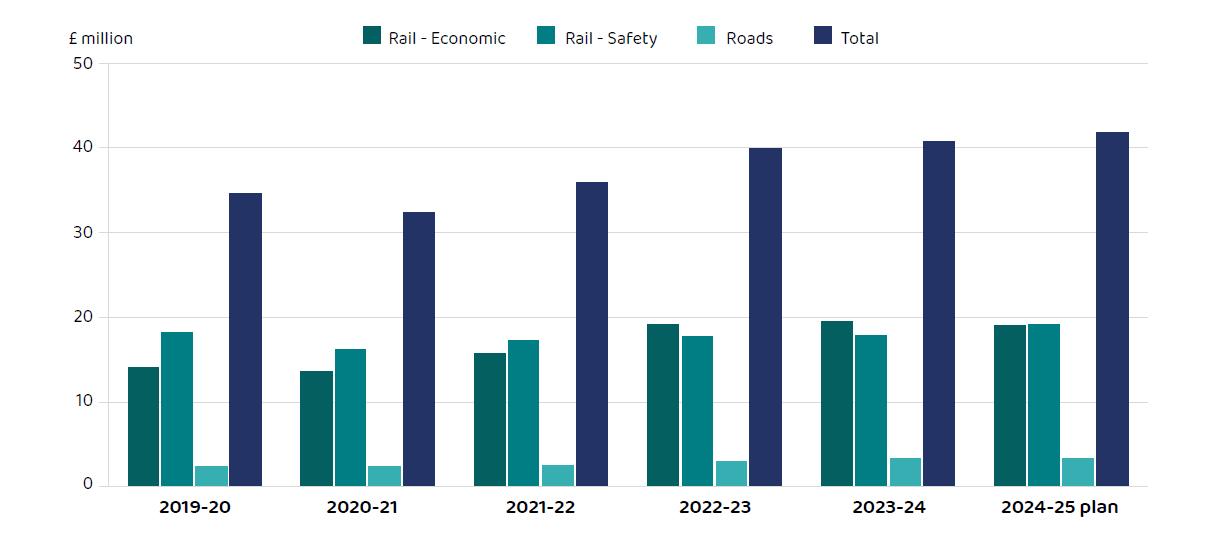
The chart below shows our spending pattern, in cash terms, over the last five years and for the 2024-25 plan, split by key work area.
The following chart shows how our spending breaks down by category of spend over the last five years and for the 2024-25 plan.
Capital expenditure
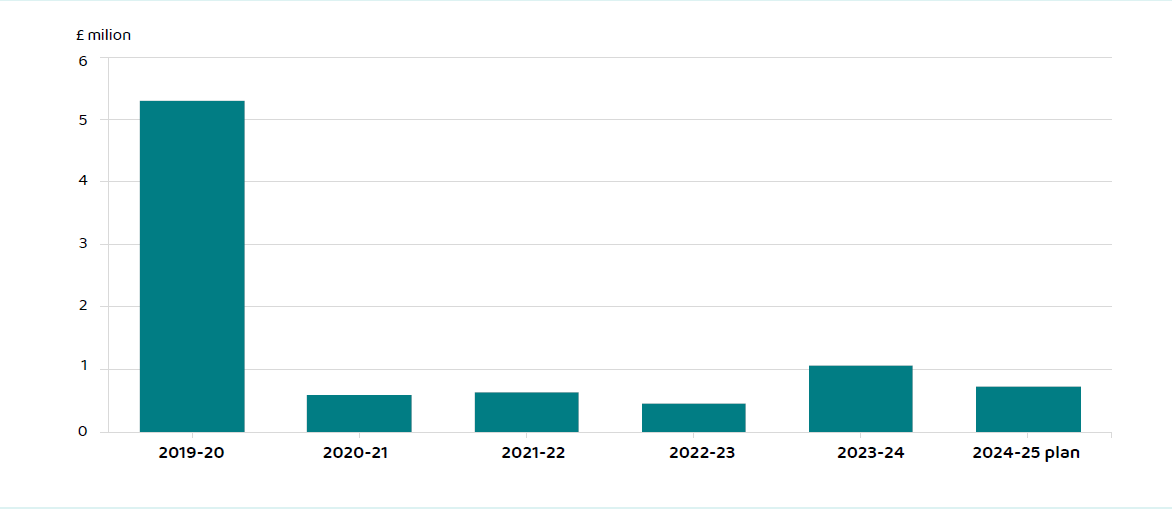
Net capital expenditure was £1.1m compared to £1.6m budget due to planned projects not taking place. The chart below shows CDEL outturn for the last five years and for the 2023-24 plan. Capital expenditure was higher than usual in 2019-20 at £5.2m due to fit-out costs associated with the London office move and 2023-24 at £1.0m due to a new IFRS 16 lease being entered into.
Net cash requirement
We had a negative net cash requirement (NCR) of £2.0m compared to £4.0m requested in the Estimate. We request an NCR to cover timing differences, and we did not use this in 2023-24.
Future plans
We agreed a multi-year budget with HM Treasury through the 2021 Spending Review. Our overall operating expenditure budget for 2024-25 will be £41.7m. We have also secured £0.7 million of capital budget, which we will use largely for renewal of operational assets.