- National Highways must remain focussed on delivering the remaining actions in its plan to further close the gap to its safety target
- National Highways has now completed all the actions set out in the smart motorway action plan
- The road works to install more safety features have limited the data available to assess performance of ‘all lane running’ smart motorways, but nationally safety systems are meeting targets
Safety continues to improve on England’s motorways and major A-roads, but National Highways is unlikely to meet its main safety target set by government, the Office of Rail and Road (ORR) said today in its third annual assessment of safety on the strategic road network.
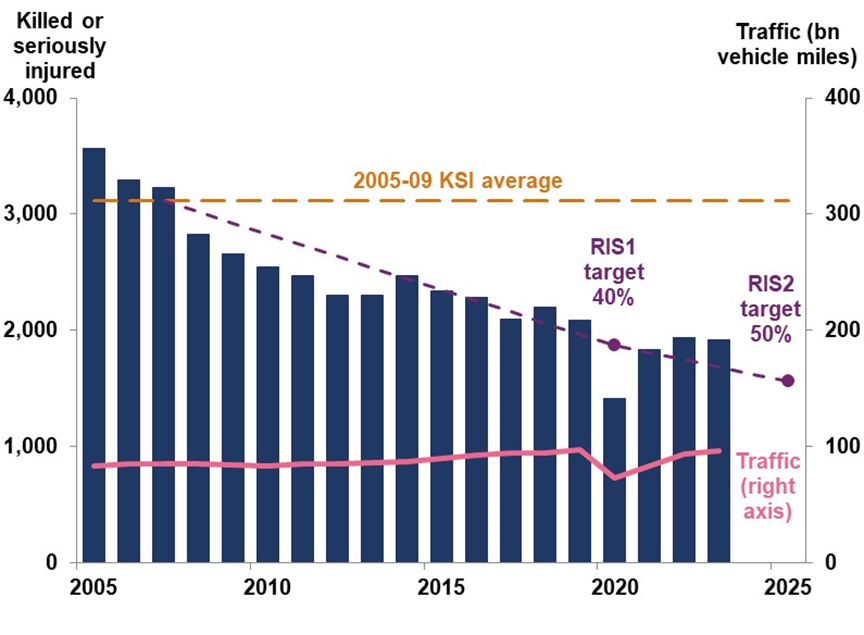
Excluding 2020 and 2021, when there was significantly less traffic due to the pandemic, these latest figures show the fewest number of people killed or seriously injured on the strategic road network (motorways and main A-roads) ever recorded, despite traffic increasing by 2.2% between 2022 and 2023.
Safety Improvement Plan
At ORR’s request, National Highways provided the regulator with a plan to improve safety on the network, and the company is on track to complete the actions it outlined by the end of 2025.
However, ORR’s assessment is that National Highways is unlikely to meet its target of halving the number of people killed or seriously injured on the strategic road network by the end of 2025. The regulator has said that National Highways must remain focussed on delivering the remaining actions in its plan to further close the gap to its target.
Impact of the NEAR programme on all lane running smart motorways
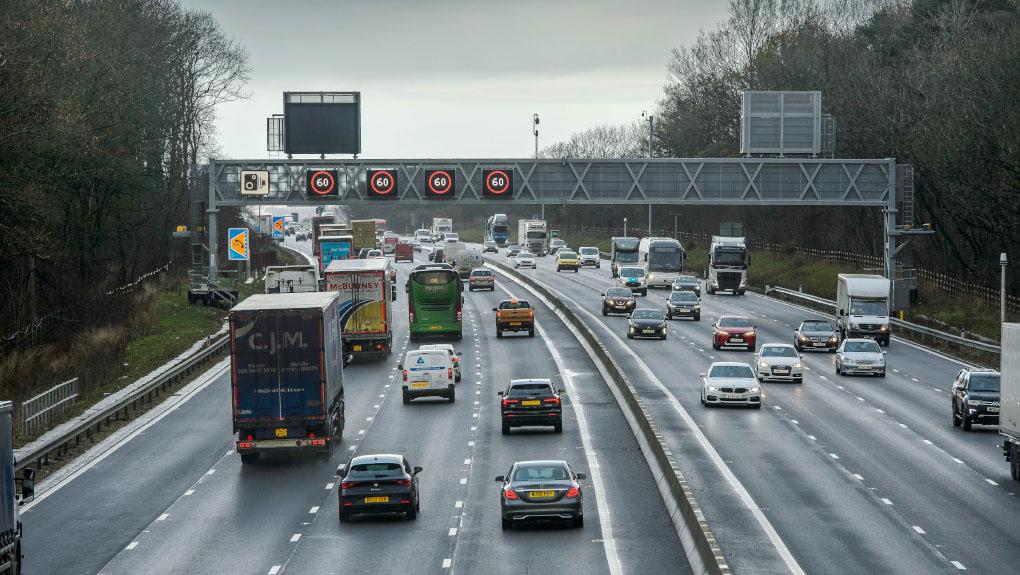
This year, widespread road works to support the installation of safe stopping areas on all lane running smart motorways, as part of the National Emergency Area Retrofit (NEAR) programme have limited the data available to ORR for its analysis of smart motorways.
Stopped Vehicle Detection (SVD) technology is one component in National Highways’ system that supports free flowing traffic and road-user safety on smart motorways. This system is designed to ensure that there is no over-reliance on a single feature. The available data show that, at a national level, SVD continues to meet the performance requirements set by the company, but some individual schemes missed targets, with seven out of 36 metrics below target across 12 tested sites. Despite this, the SVD system continues to deliver safety benefits for road users.
In its report ORR has told National Highways to improve the data it collects on technology outages on all lane running smart motorways, so that the company can better understand the effects of outages on road users.
National Highways has now delivered all the measures set out in the smart motorway evidence stocktake and action plan set by the government in 2020.
Feras Alshaker, Director, Performance and Planning, said:
Notes to Editors
- The Office of Rail and Road (ORR) is the independent economic and safety regulator for Britain’s railways, and has regulatory powers to hold National Highways to account.
- The Strategic Road Network comprises England's motorways and major A-roads
- Casualty rates on the SRN (20 KSI casualties per billion vehicle miles) remain significantly lower than on local roads (130 KSI casualties per billion vehicle miles)
- Figure: Killed or seriously injured (KSI) casualties (adjusted), safety targets and traffic on the SRN, 2005-2023