Content archived on 03 April 2025
ORR's 'GB rail industry financials information 2012-13' report provides a detailed analysis of the latest financial data from train operators, Network Rail and governments. The third annual publication of ORR's rail industry financials report includes new information about the industry, it contains a breakdown of fares income and more detail on the composition of costs. The report does not seek to investigate or explain reasons for significant differences in train companies' costs, which can differ widely reflecting the type of services provided, and number of passengers carried.
The report also assesses financial trends over the past three years, during which time the rail industry has achieved high levels of growth as passenger journeys have increased by 10.4% and the amount of freight carried on the network has risen by 29.7%.
The GB rail industry financial information report for 1 April 2012 to 31 March 2013 shows that:
- Total income from passenger fares was £7.7bn – 3.6 % higher than in 2011-12 (and 7.2% higher than 2010-11). This is largely due to more passenger journeys on the network.
- The industry earned nearly £3bn from discounted tickets (such as advance, off-peak, super-off peak and special offers) – amounting to over 40% of the total passenger income.
- The cost of running Britain's railways was £12.3bn in 2012-13. This overall cost has remained consistent over the past three years. Taking account of passenger growth, the industry's cost, for every kilometre a passenger travels, has fallen significantly (down by 6.2% since 2010-11).
- Passengers covered an increasing proportion of the rail industry's income relative to taxpayers over the past three years – 59.2% of industry costs in 2012-13, compared to 57.4% in 2011-12 and 55.6% in 2010-11.
- Total Government funding was £4bn in 2012-13, representing 30.9% of the industry's total income. Government funding decreased by 4.2% compared to 2011-12, and by 9.1% in 2010-11.
- There are significant variations in the level of government funding between England, Scotland and Wales. Total funding varied from £2.19 per passenger journey in England, to £7.60 per journey in Scotland, and £9.33 per journey in Wales.
ORR chief executive, Richard Price, said:
Britain's rail industry receives substantial income from passengers and taxpayers. People have a right to know where the money goes and what it helps deliver. ORR welcomes the industry's support in compiling this report. It demonstrates a real step forward for the rail sector, which, with ORR's help, is developing a stronger culture of openness and transparency, and providing more detailed data on costs, income and fares.
Passengers are increasingly the main funder of the railways, and must be central to developing its plans for the future. ORR is working to put passengers at the heart of the railways – working with the industry to ensure passenger groups have a greater say in plans and delivery of new enhancements to the rail network; to review the quality of information provided to passengers during the recent disruptions; and to establish a code of practice on rail ticket selling.
Industry income, expenditure and Government funding April 2012 - March 2013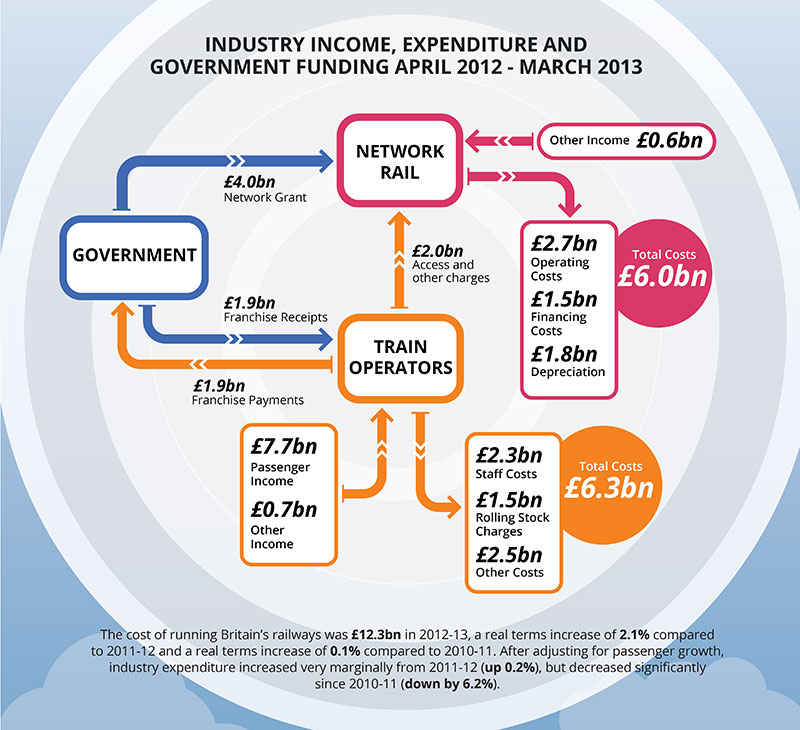
Notes to editors
- Follow the Office of Rail Regulation on Twitter @railregulation for the latest announcements and rail data.
- Download the complete 'GB rail industry financials information 2012-2013' report and our infographic.
- The £3bn value of income from discounted fares has been estimated from ORR's analysis of the percentage contribution of different fare types in 2012 applied to 2012-13 passenger income.
- All figures are adjusted for inflation.
- The cost of running Britain's railways was £12.3bn in 2012-13. Half of these costs were incurred in train operations and half were incurred in managing the rail infrastructure.
- Taking into account passenger growth, industry expenditure increased very marginally from 2011-12 (up 0.2%), but decreased significantly since 2010-11 (down by 6.2%).
- There are significant variances in train operating costs between franchises. There will be many reasons for these such as nature of the franchise and costs which are only partially controllable by train operators. For example, rolling stock charges paid by Virgin Trains were £302m and those paid by East Coast were £53m. A key driver for this variance is likely to be the age and type of rolling stock used by these operators. The average age of Virgin Trains rolling stock is 9 years and this fleet mostly comprises Class 390 Pendolinos whereas the average age of East Coast's fleet is 27 years mostly comprising of InterCity 225s.
- There are significant variances in franchise specifications, population, and size of the network and associated subsidies. This report does not seek to investigate or explain the reasons for these differences.