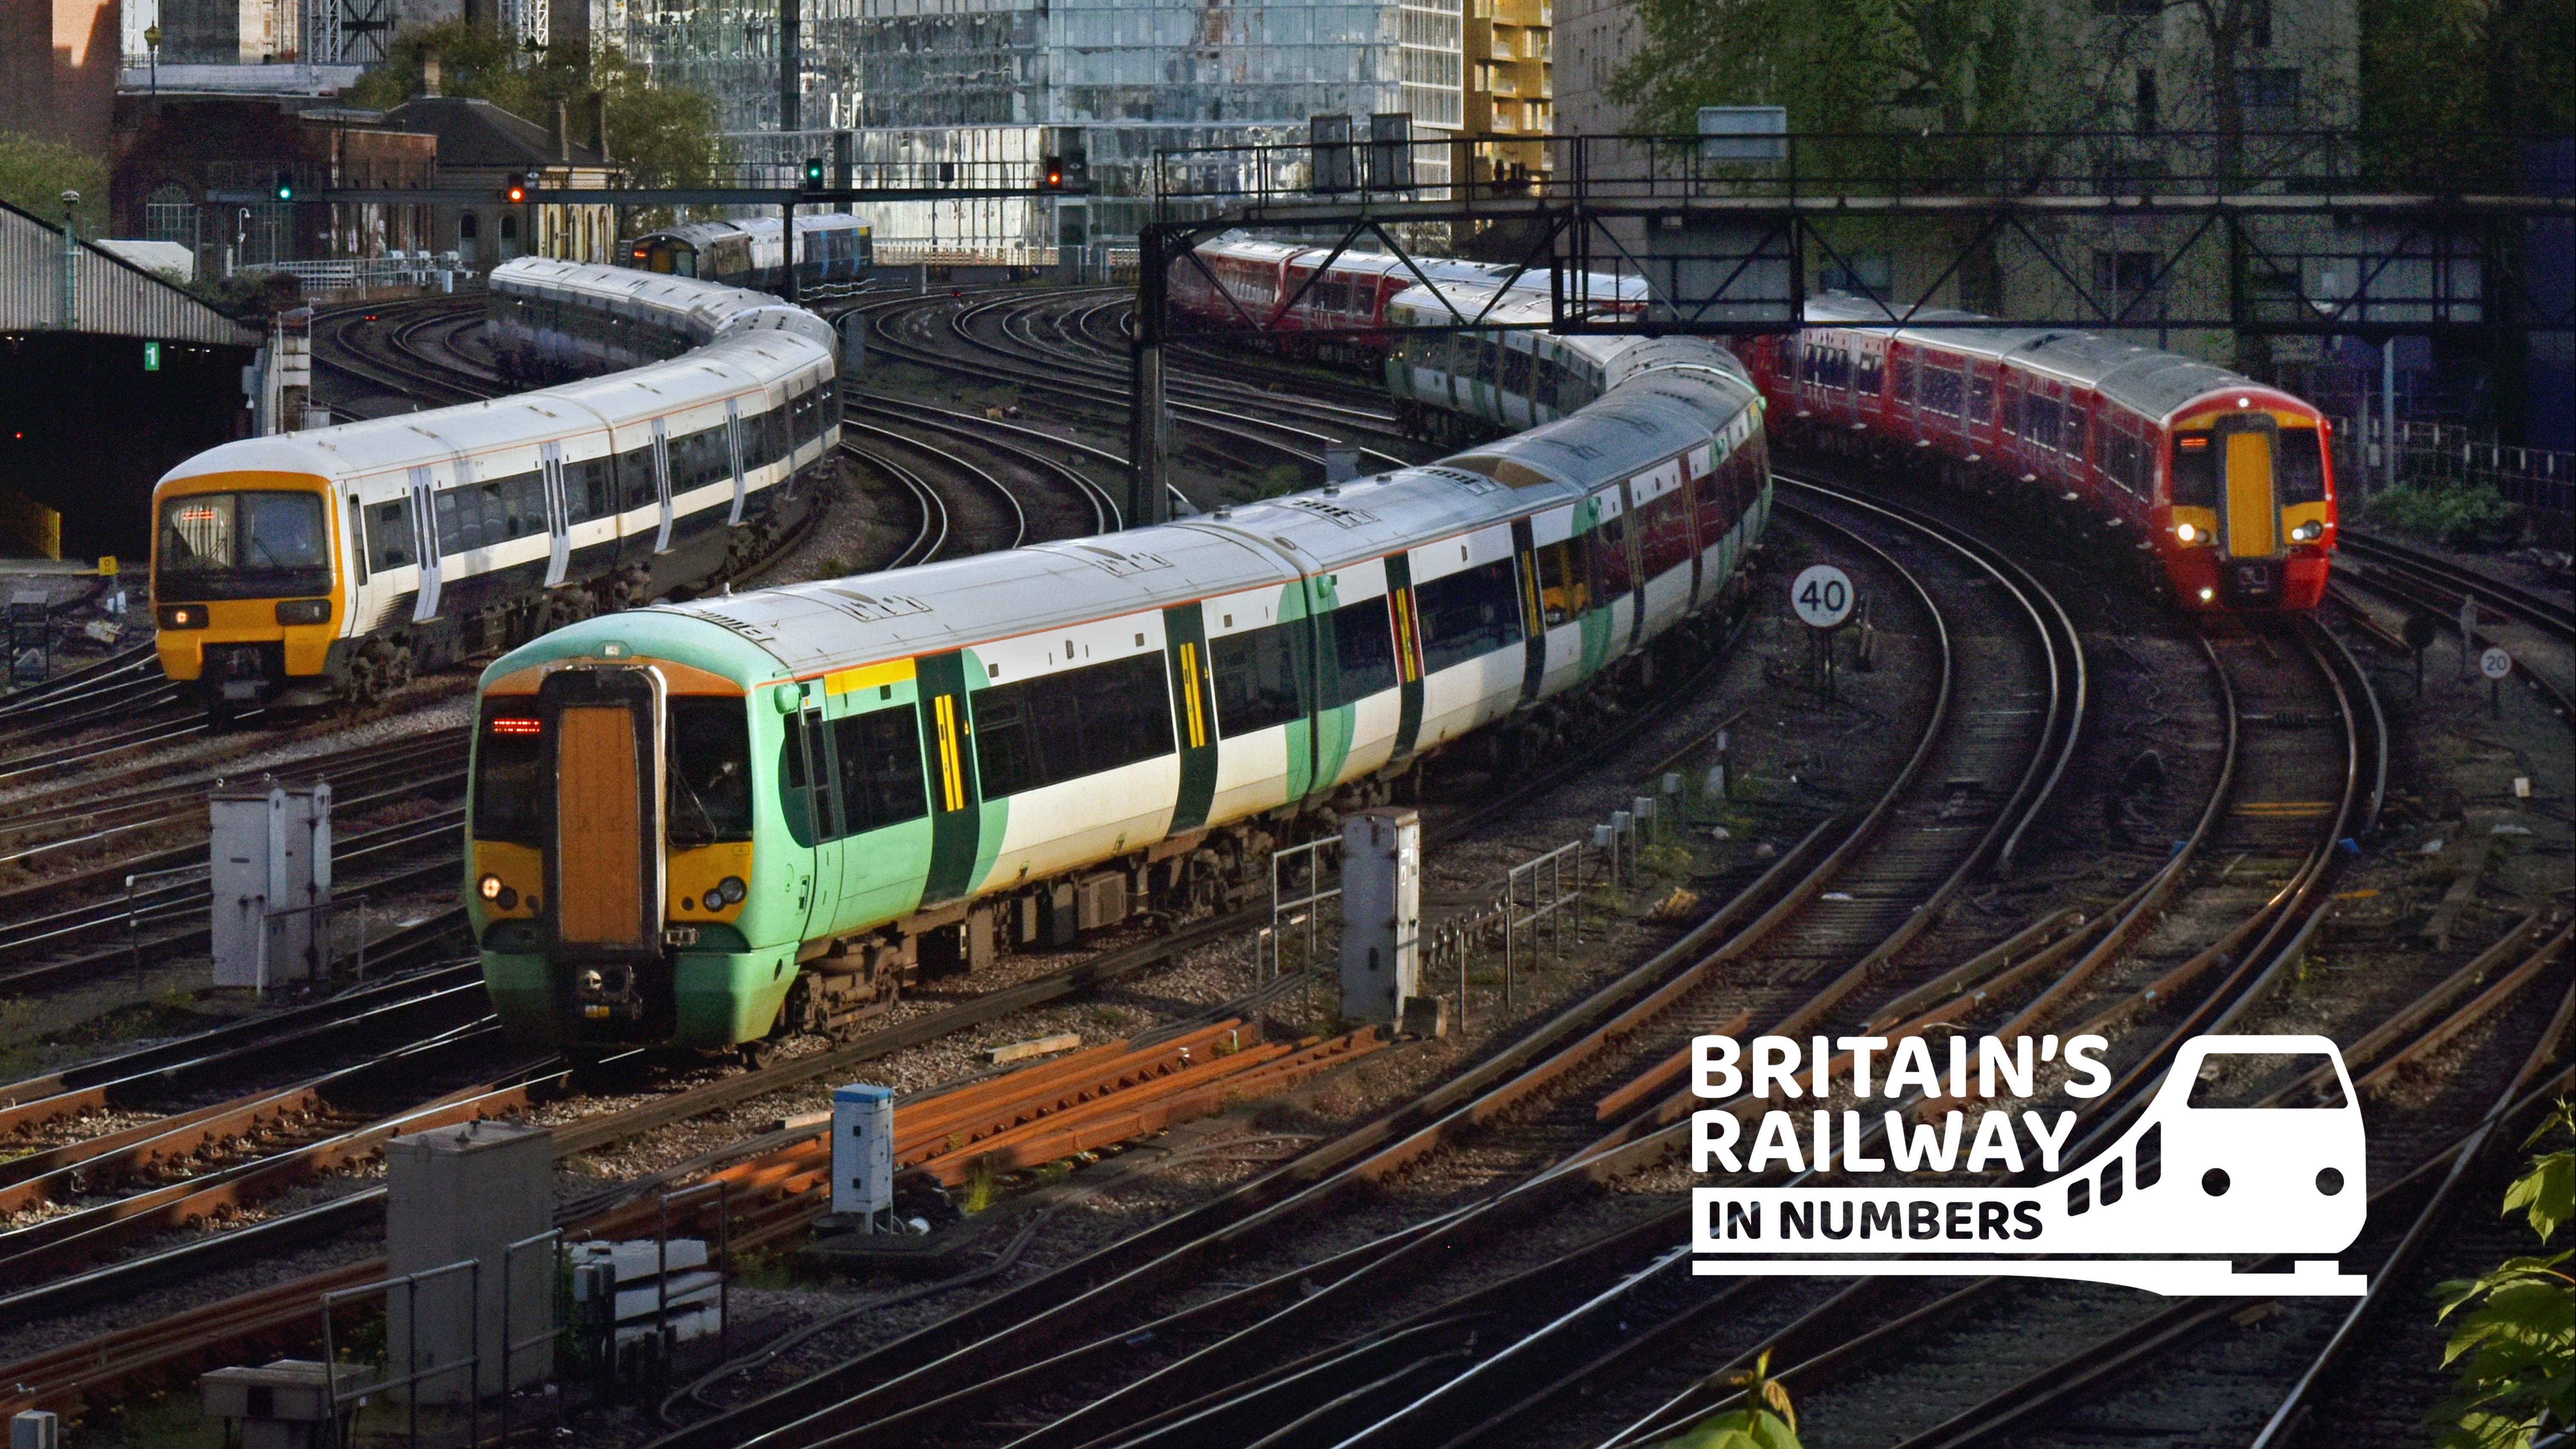
ORR publishes a wide range of official statistics, which are important in providing independent and transparent data on the state of Britain’s railway. These are all available on our data portal.
Our statistics provide trusted and transparent information to help inform debate and enable people/organisations to make decisions and to develop insight based on high-quality data.
This campaign highlights some of our most popular stats:
Estimation of station usage
- As of 31 March 2021 there were 2,569 stations in Great Britain and our annual estimates on the number of entries/exits and interchanges at each station is one of our most popular set of stats. These include information on the busiest and least used stations both nationally and regionally.
Rail industry finance
- In the financial year 2020/21, the railway industry was substantially affected by the pandemic. Total income was £20.7 billion, with £16.9 billion coming from government funding. Our industry finance stats provide a more detailed breakdown of the railway’s income and expenditure.
Rail Safety
- These annual statistics highlight the number of accidents, fatalities and injuries to passengers and workers across all rail networks in Great Britain. In 2020-21 there were a total of 361 train accidents, a decrease of 33.5% compared with the previous year.
Rail infrastructure and assets
- As of 31 March 2021, 6,045 km of the mainline railway was electrified, equating to 37.9% overall. Our popular annual rail infrastructure and assets stats also include information such as the average age of rolling stock.
Passenger rail performance
- Our quarterly passenger rail performance statistics show the punctuality, reliability and causes of delay for passenger trains operating on the mainline network in Great Britain. In the year ending March 2021, 79.9% of recorded station stops in Great Britain were arrived at on time compared to 64.8% the previous year.
Freight rail usage and performance
- Rail freight is used to transport everything from raw materials such as coal to domestic products. In the year ending March 2021, 15.2 billion tonne-kilometres of freight was moved on the railways. Our freight rail usage and performance stats provide a more detailed breakdown on what is moved, who it is moved by, distance the goods travel, and the punctuality of freight trains.
Passenger rail usage
- These stats cover the volume of passenger journeys, kilometres, and revenues on the mainline network in Great Britain. Passenger journeys fall to 387.9 million in the year ending March 2021, a decrease of 22.3% compared with the previous year due to the impact of the pandemic. However, the latest quarterly statistics covering 1 July to 30 September 2021 show a total of 248 million rail passenger journeys just in that quarter, an increase of 85.8% compared with the 133 million journeys made in the same quarter last year. These stats also show how many passengers travel on each train operator.
Passenger rail service complaints
- There were 133,003 complaints closed in the year ending March 2021, down 75.1% compared with the previous year. Complaints to train operators cover everything from punctuality/reliability to ticketing and refunds policy. The passenger rail service complaints stats also provide a breakdown of complaints for each train operating company and their response rates.
Delay compensation claims
- When trains are delayed, passengers have a right to claim for delay compensation. In the year ending March 2021, 394,948, delay compensation claims were closed. These stats also show how effective train operating companies are at processing claims and how many are actually approved.
Our Britain’s Railway in Numbers Campaign will run over the coming months, with more animations added every week.


