The new Elizabeth line, which runs from beyond the western and eastern edges of the capital, has also impacted the figures for Paddington, Farringdon and Tottenham Court Road which all feature in the top-10 stations.
Paddington was the second busiest station, up four places from last year, with 59.2 million entries and exits, while Farringdon has risen 29 places to number nine (31.5m). Tottenham Court Road’s Elizabeth line station opened in May 2022 and enters the list for the first time as the seventh busiest station with 34.9 million entries and exits. London Waterloo drops down to third (57.8m), while London Bridge is fourth (47.7m).
The busiest stations outside London were Birmingham New Street (30.7m), Leeds (24.0m) and Manchester Piccadilly (23.6m), ranking 11th to 13th overall.
Glasgow Central was the most used station in Scotland with 20.8m entries and exits and Cardiff Central topped the list in Wales (10.2m).
The top 10 most used stations in Great Britain
| Rank | Station | Entries and exits | Rank one year ago |
|---|---|---|---|
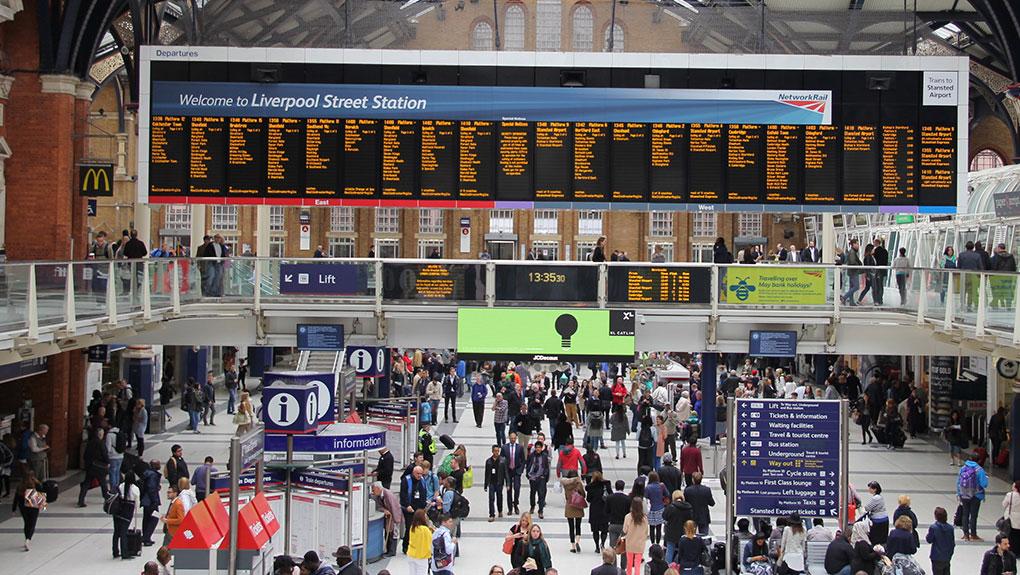
| 1 | London Liverpool Street | 80.4 million | 4 |
| 2 | London Paddington | 59.2m | 6 |
| 3 | London Waterloo | 57.8m | 1 |
| 4 | London Bridge | 47.7m | 3 |
| 5 | London Victoria | 45.6m | 2 |
| 6 | Stratford (London) | 44.1m | 5 |
| 7 | Tottenham Court Road | 34.9m | New entry |
| 8 | London St Pancras International | 33.3m | 12 |
| 9 | Farringdon | 31.5m | 38 |
| 10 | London Euston | 31.3m | 7 |
The top 10 most used stations outside London
| Station | Entries and exits |
|---|---|
| Birmingham New Street | 30.7 million |
| Leeds | 24.0m |
| Manchester Piccadilly | 23.6m |
| Glasgow Central | 20.8m |
| Edinburgh Waverley | 18.2m |
| Gatwick Airport | 16.5m |
| Brighton | 14.1m |
| Reading | 12.4m |
| Glasgow Queen Street | 12.3m |
| Liverpool Central | 11.4m |
The least used station was Teesside Airport which had two entries and exits in the latest year, however its once-a-week Sunday service was suspended in May 2022 after the platform was classified as unsafe.
The least used station that was open throughout the whole year was Denton in Greater Manchester with 34 recorded entries and exits. Third-place Elton and Orston in Nottinghamshire was the least visited in the previous year with 40 entries and exits; that number increased by 16 in this reporting year.
There were five open stations with 100 or fewer entries and exits in the latest year:
- Teesside Airport, Darlington (two entries and exits)
- Denton, Greater Manchester (34)
- Elton and Orston, Nottinghamshire (56)
- Kirton Lindsey, North Lincolnshire (94)
- Reddish South, Greater Manchester (100)
The report also presents data of the busiest flows between pairs of stations for the first time, with four of the top 10 on routes only served by the Elizabeth line. Between London Liverpool Street and Tottenham Court Road led the statistics with 5.8 million journeys, while the busiest flow outside of the capital was between Birmingham New Street and Coventry (2.1m).
Feras Alshaker, Director of Planning and Performance at the Office of Rail and Road, said:
Notes to editors
- ORR’s estimates of station usage April 2022 to March 2023
- Estimates of station usage FAQs
- Latest station usage data tables and interactive dashboard
- The Estimates of Station Usage report says 2,578 stations were served by mainline rail services as of 31 March 2023, including eight new stations which opened during the year. A total of 1,385 million passenger journeys were made during the latest reporting period, an increase of 40% from the 990 million journeys made in the previous year (April 2021 to March 2022).
- Estimates of station usage are derived from LENNON, the rail industry’s ticketing and revenue system, together with some local ticketing data. A number of adjustments are made to the source data to make the estimates as accurate as possible
- Many of the journeys made using the new Elizabeth line infrastructure were previously made using other methods of public transport in London, such as the London Underground or Docklands Light Railway. However, a recent TfL board paper (Elizabeth Line Passenger Usage Insight - section 6) suggested that around 30% of the Elizabeth line journeys were ‘new’ demand, i.e. generated trips which would not have been made without the existence of the Elizabeth line, or mode shift from non-public transport.
- The Origin and Destination Matrix (ODM) which contains the estimated number of journeys between each pair of mainline stations in Great Britain during April 2022 to March 2023 will be published on the Rail Data Marketplace in February 2024, following the release of our Regional Rail Usage publication. The ODM covering April 2021 to March 2022 is available to download.
- The Office of Rail and Road is the primary producer of official statistics for rail.

