Assurance that the health risks are being effectively and efficiently managed can only be achieved if there is a full understanding of the health risk profile of the organisation, proportionate to the significance of the risks.
More effort is needed to understand those risks that can cause irreversible harm or are most prevalent.
An effective way of establishing this is through the use of bow tie analysis. An overview of the technique is provided on the CGE website.
Bow tie analysis will typically involve a series of workshops involving those with expertise and experience of the hazards being assessed.
Data sources that can be used to inform bow tie analysis include:
- Legislation and associated guidance;
- Workshops;
- Health performance data; and
- Good practice guidance.
The output should be a bow tie diagram(s) which show the mechanisms by which occupational ill health may arise; its consequences; and the means of control and mitigation. Identifying the controls is essential as they show:
- The nature of the control (e.g. design, engineering control, procedural control etc);
- The responsibility for implementing the control;
- The quality of the control; and
- The effectiveness of the control.
The threat lines should be arranged so that the causal factors are ranked by frequency, with the highest frequency causal factors at the top. They can also be grouped into user defined categories (such as task, individual, load, or equipment).
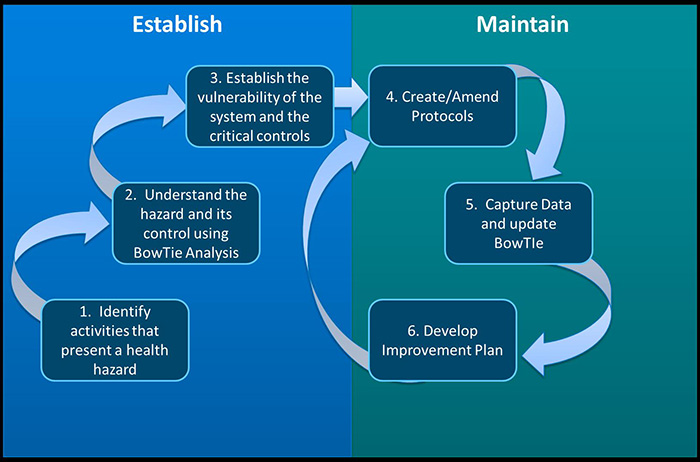
Figure 1 below provides an overview of a six stage approach to assurance. The last three stages form a management cycle once the first six steps are completed.

An example bow tie diagram for manual handling within a train operating company (TOC) is available to download. This example is for illustrative purposes and is not a fully developed assessment.
- Example of a bow tie analysis for manual handling (illustrative only).

